
What Is AR Product Visualization? A Buyer's Guide for Ecommerce Brands
Aug 10, 2026

13 MIN READ
AR product visualization is technology that overlays a true-to-scale 3D model of a product onto a shopper’s real environment through a phone or tablet camera, so a buyer can see a sofa on their own floor or a speaker on their own desk before ordering. A custom WebAR build typically costs $25,000 to $75,000 and ships in 6 to 16 weeks; hosted SaaS viewers start around $140 to $500 per month.
Most ecommerce AR projects underdeliver for one reason, and it is rarely the AR itself. The 3D asset is wrong: under-optimized, mis-scaled, or exported for only one platform. Get the model pipeline right and the conversion gains follow. Get it wrong and no amount of clever AR wrapping saves the experience.
Key Takeaways
- AR product visualization renders products at 1:1 scale in a shopper’s space via WebAR (no app) or native ARKit and ARCore apps.
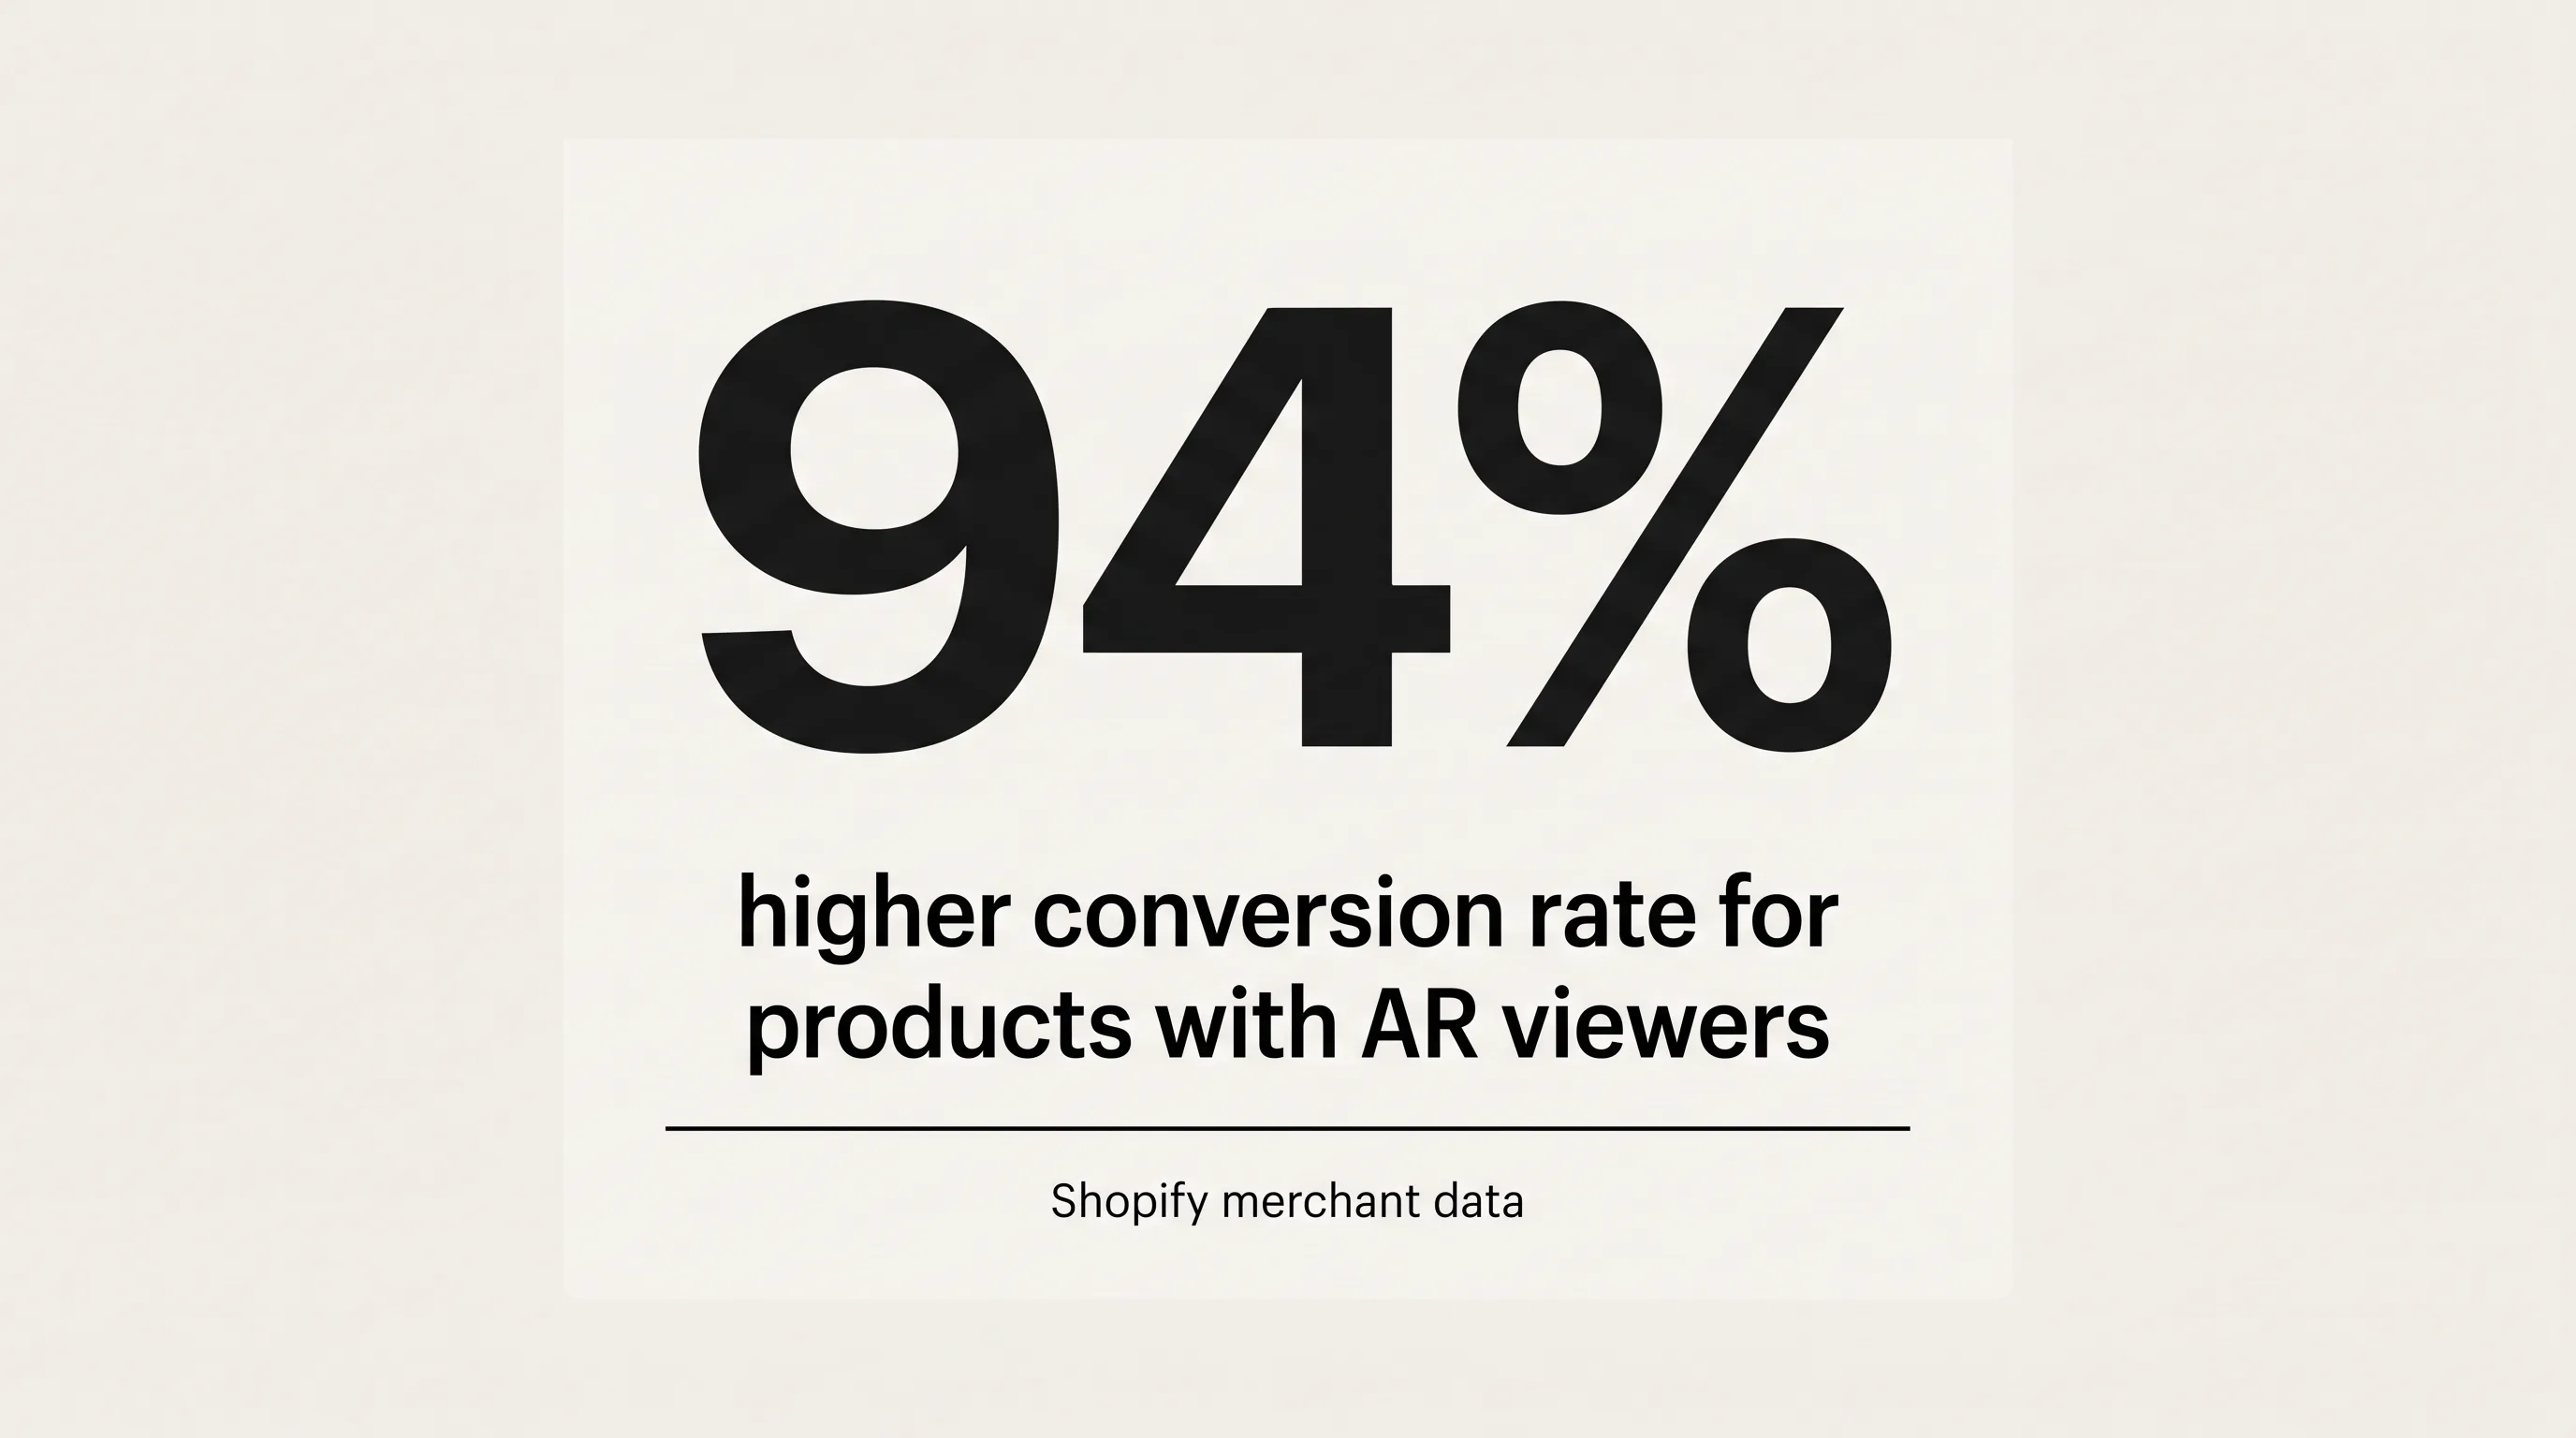
- Shopify merchant data shows products with 3D/AR content convert 94% higher than flat images; documented cases cut returns up to 40%.
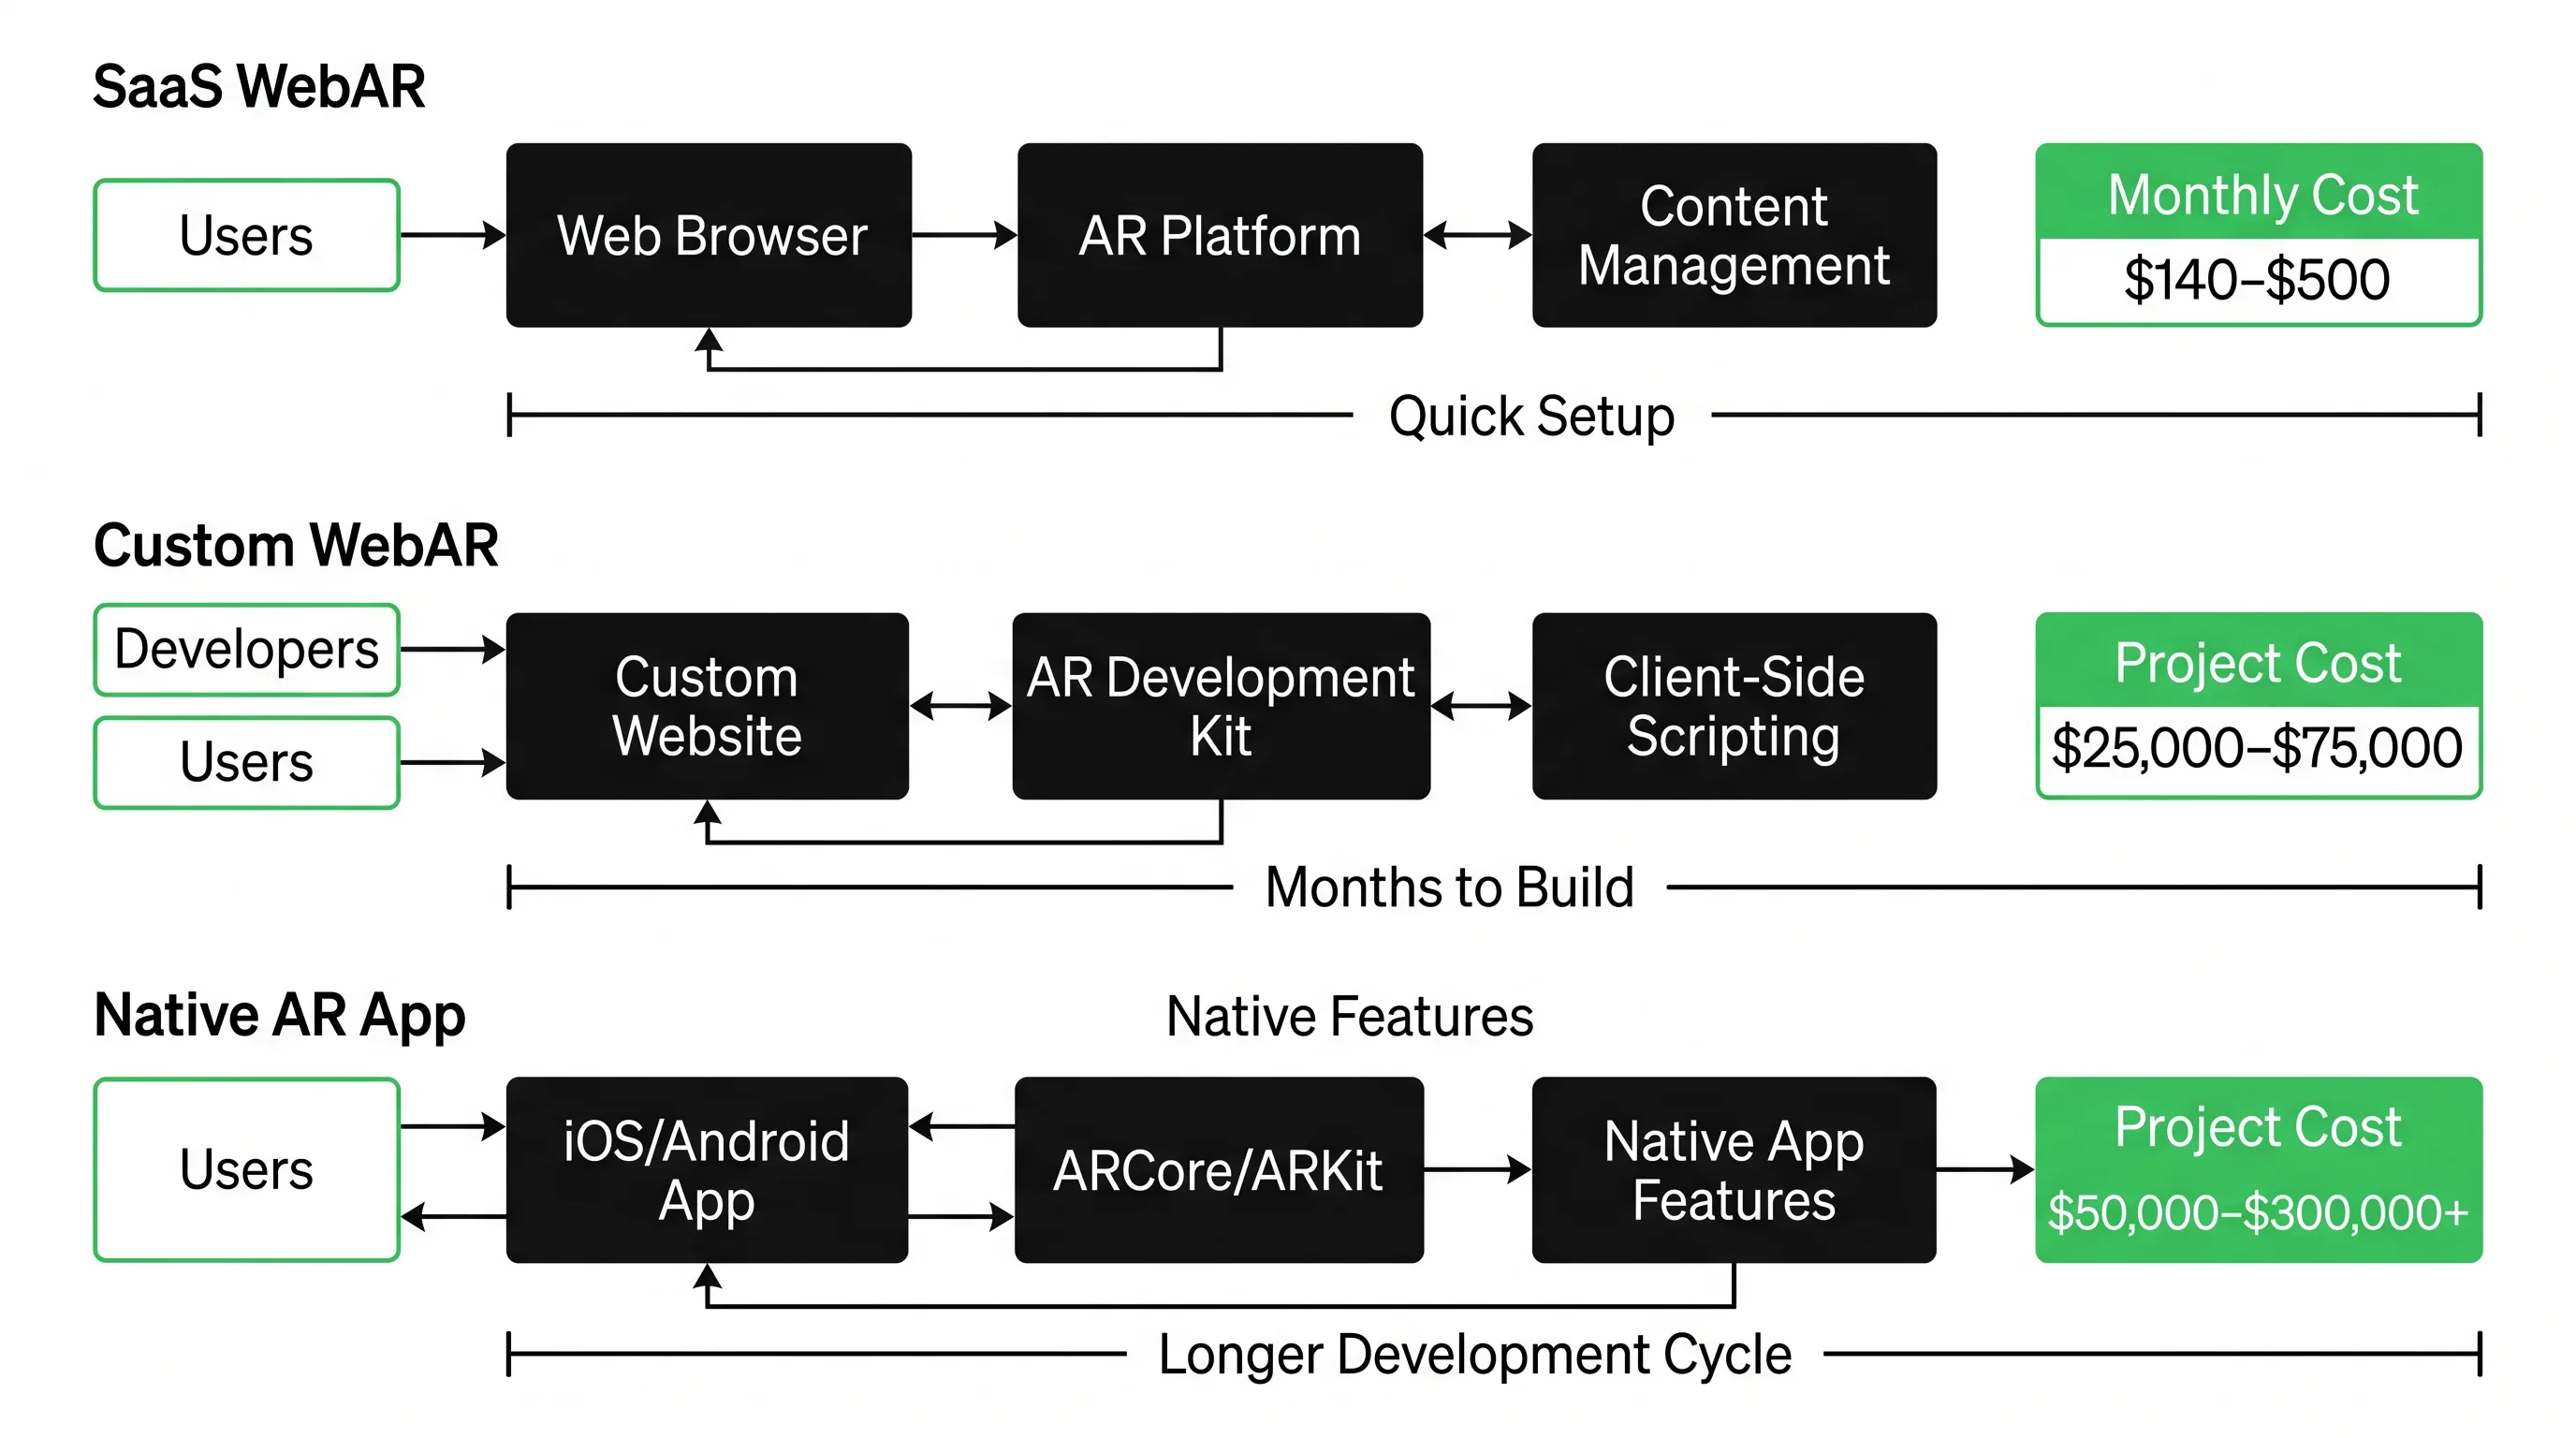
- Cost ranges span $140–$500/month (SaaS), $25,000–$75,000 (custom WebAR), and $50,000–$300,000+ (native app).
- Ecommerce AR needs both USDZ (iOS AR Quick Look) and glTF/GLB (Android Scene Viewer); one format never covers all devices.
- 3D asset production is usually the largest budget line, at $100 to $1,000+ per SKU.
What Is AR Product Visualization and How Does It Work?
AR product visualization lets a shopper place a life-sized, interactive 3D model of a product into their own room using a phone or tablet. The device camera and markerless SLAM tracking map the floor or a tabletop, then anchor a glTF or USDZ model at true scale. The shopper walks around it, rotates it, and checks fit before buying.
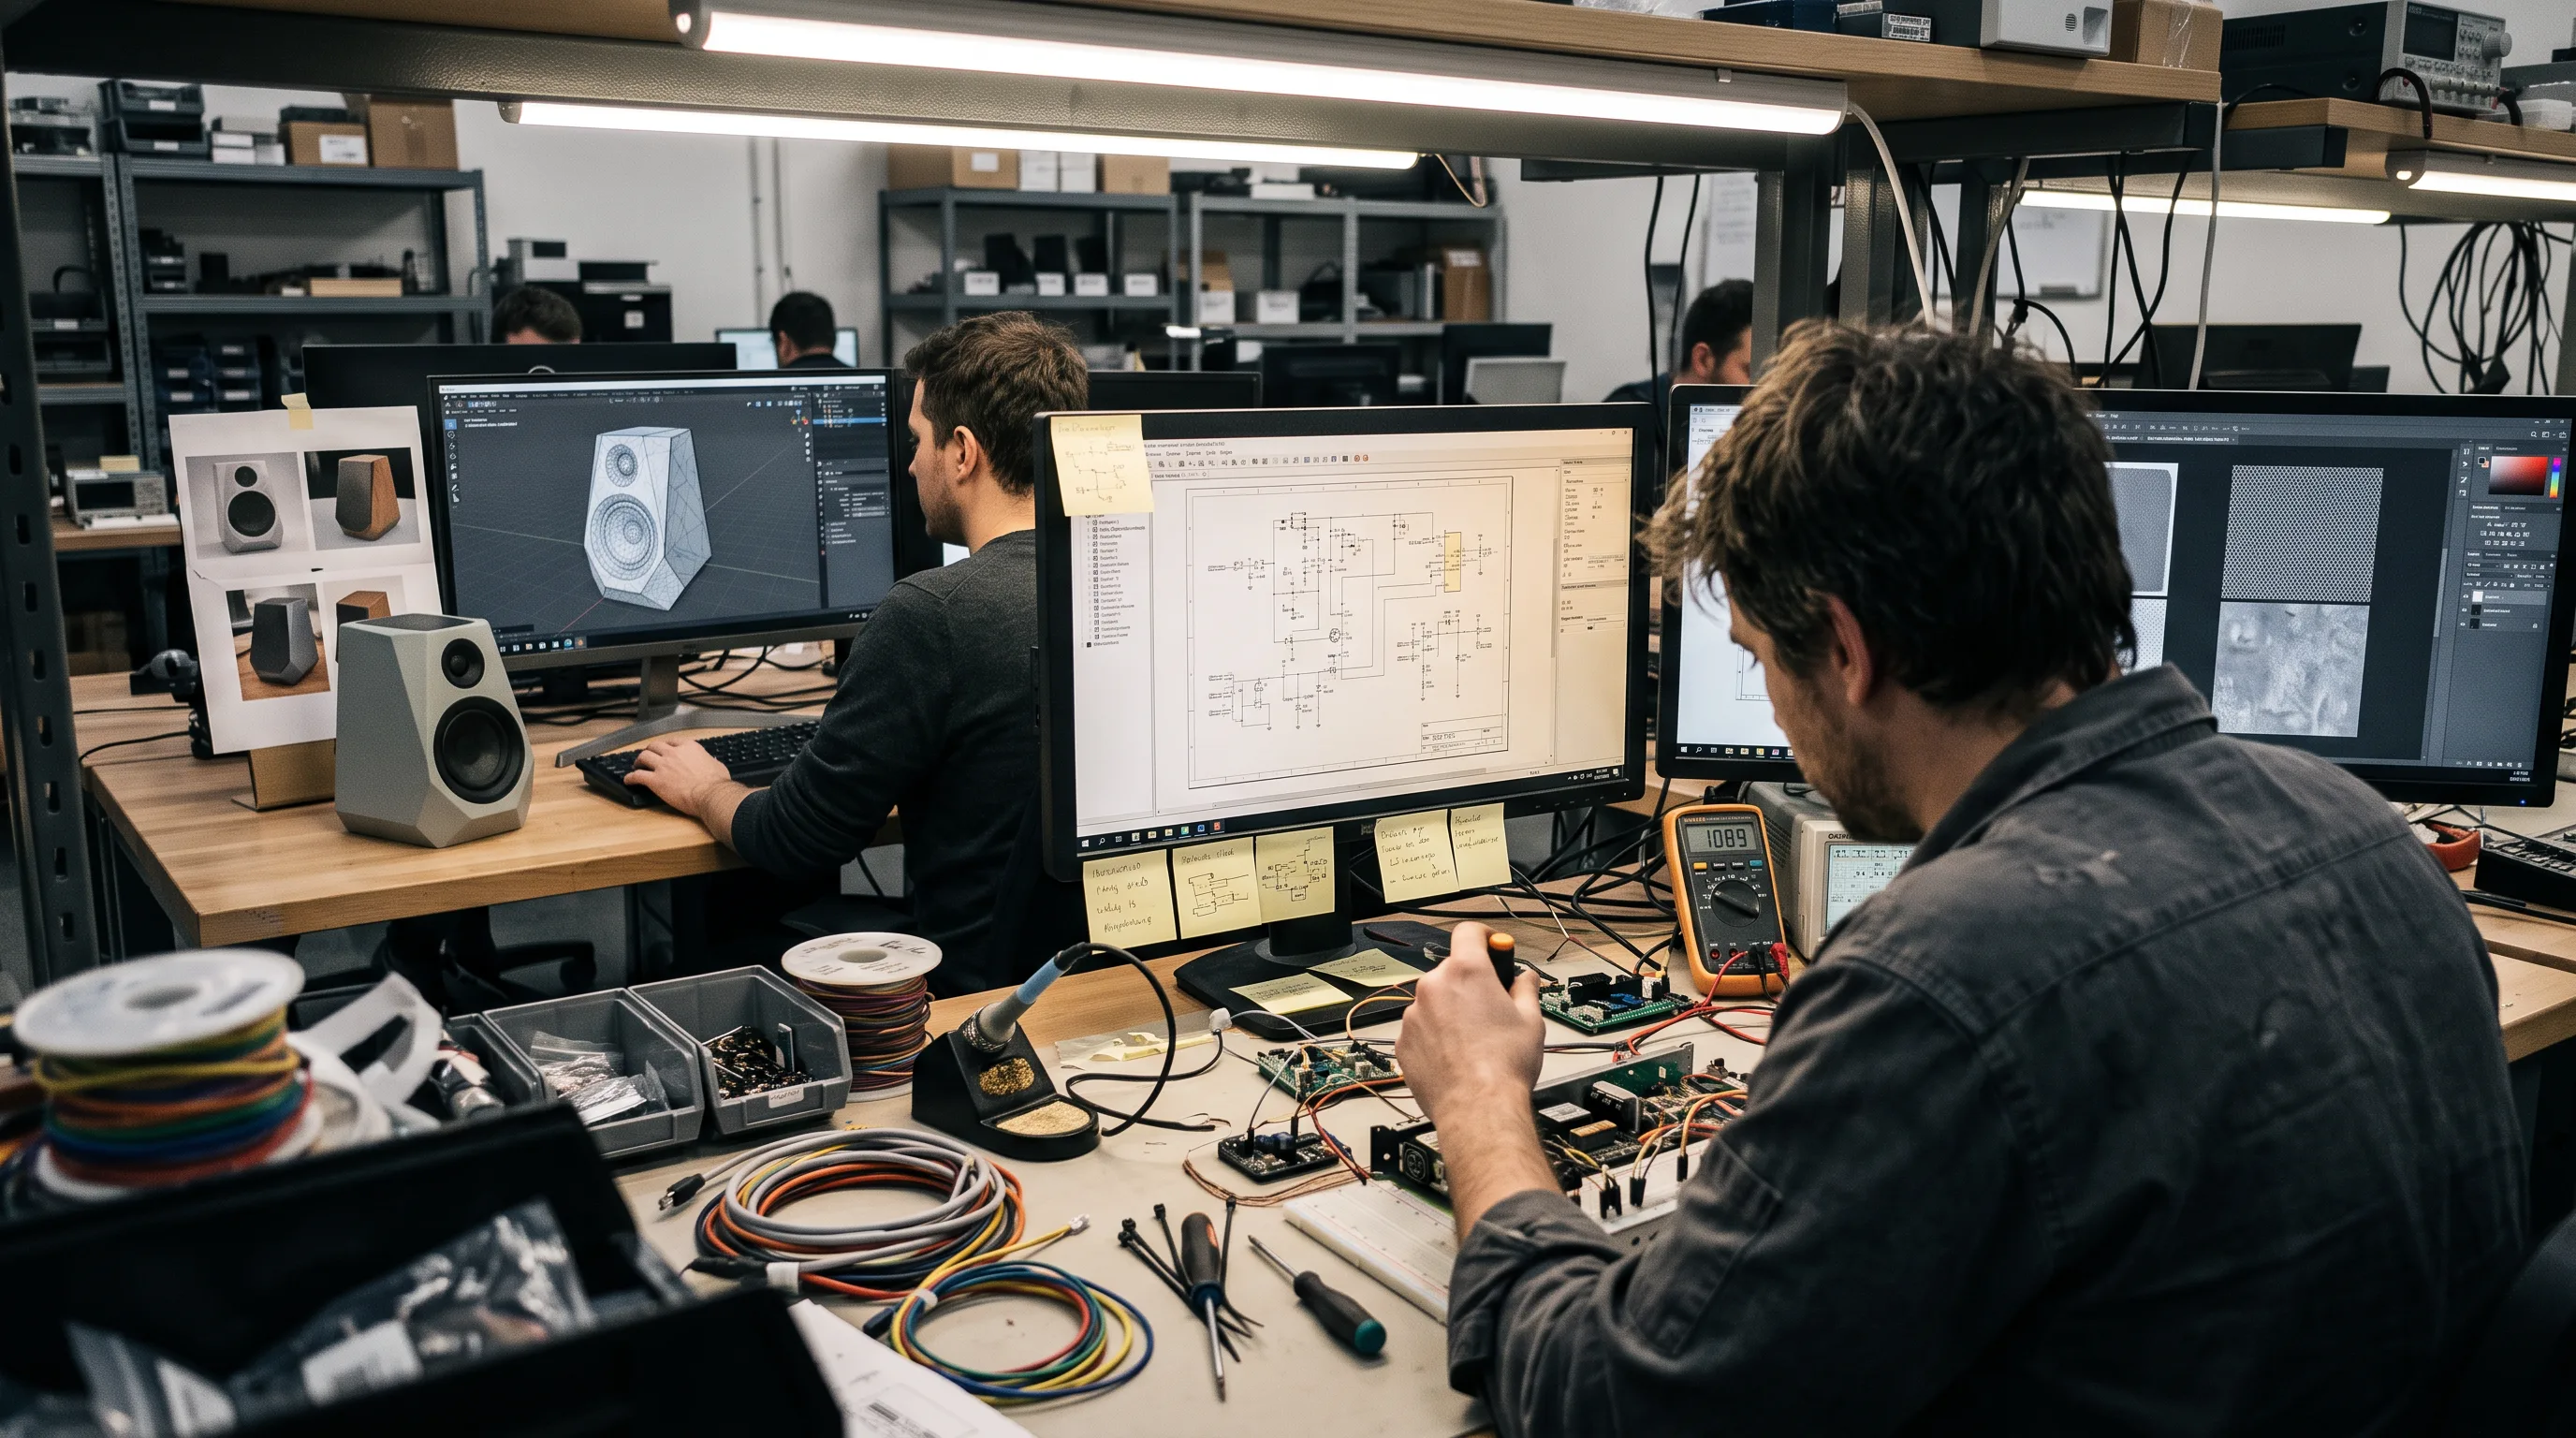
Two modes cover most retail needs. “View in your space” anchors larger items like furniture and appliances to a detected surface. “View in 3D” spins a smaller product on a floating pedestal for close inspection. Both run in a mobile browser through WebAR or inside a native app built on Apple’s ARKit and Google’s ARCore, and neither requires a headset.
The reach is already there. Over 90% of current smartphones support at least one AR form as of 2026, according to XICTRON’s 2026 AR commerce guide. This differs from AR try-on, which tracks a face or body to place glasses, makeup, or apparel on the shopper rather than in the room. For the broader category context, our overview of augmented reality in ecommerce maps how these formats fit together.
What Conversion Rates and ROI Can You Expect from AR Product Visualization?
AR product visualization consistently lifts conversion and cuts returns, though the size of the gain depends on the product category and the quality of the 3D asset. Furniture, home goods, and other high-consideration items see the largest effect, because the gap between a flat photo and the physical object is widest there. Treat published figures as direction, not a contract.
Abdullah Al Baki, Founder and Creative Director of 7CGI, frames it plainly in the firm’s AR product visualization guide: the widely cited benchmarks are “directional benchmarks, not guarantees.” That caveat matters when you build a business case.
Conversion Rate and Engagement Benchmarks
Products with 3D or AR content convert at markedly higher rates than products shown as flat images. Shopify merchant data puts the lift at 94%, a figure first published in 2022 and reconfirmed in later reporting. The effect shows up across categories and repeats often enough to be a planning assumption, not an outlier.
The named case studies back this up:
- IKEA Place drove a 189% conversion lift for AR users (Apple/IKEA).
- Rebecca Minkoff saw a 44% higher add-to-cart rate and a 65% increase in order likelihood when shoppers engaged with AR, per Neural4D’s 2026 Shopify 3D guide.
- Shoppers spend 75 seconds with a 3D viewer versus 49 seconds without, according to Vertebrae data cited in XICTRON’s 2026 report.
Demand is skewed young. 92% of Gen Z shoppers say they want AR when shopping (Snap, cited 2026), and 61% of consumers overall prefer retailers that offer AR (NielsenIQ, cited 2026). Engagement time and preference both point the same way.
Return Rate Reduction and Revenue Impact
Return reduction is where AR product visualization often pays for itself. Accurate scale, color, and finish previews stop the “it didn’t fit / didn’t look like the photo” return before it happens. Reported reductions reach up to 40%, per Shopify and Deloitte data cited in XICTRON’s 2026 guide, and AR users generate 21% higher revenue per visit and 13% higher average order value, according to Zolak’s 2026 AR product visualization guide.
The revenue-per-visit numbers get the attention, but the returns math is usually the faster payback. A brand with a 25% return rate and heavy reverse-logistics costs recovers margin on every avoided return, and that saving lands immediately rather than waiting on incremental traffic. Zolak documents one worked case where an $11,000 investment produced $22,500 in net profit over six months, roughly a 205% return. The AR ecommerce market itself reached $6.3 billion in 2024 and is projected to hit $74 billion by 2035 (Markets and Markets, cited 2026). The wider XR market is moving too: headset and glasses shipments grew 44.4% year over year in 2025, per IDC data compiled by SQ Magazine’s 2026 AR statistics roundup.
For fashion, footwear, and accessories, the return-reduction lever pairs naturally with AR try-on, which ties the experience directly to fit and conversion metrics.
How Much Does AR Product Visualization Cost to Build?
AR product visualization costs range from a few hundred dollars a month for a hosted viewer to six figures for a custom native app, driven mainly by two variables: how you deliver the experience and how many products you model. Delivery method sets the platform cost; SKU count sets the 3D asset cost. The asset side is the one most buyers underestimate.
SaaS WebAR: The $140–$500/Month Starting Point
Hosted SaaS platforms are the fastest way to put a working AR viewer on a product page. They provide a pre-built viewer and configurator on a subscription, usually $140 to $500 per month depending on tier and catalog size. Platforms like Augment sell this model to retailers and manufacturers who want AR live in days.
The trade-offs are real. You get a standard viewer UX, limited brand customization, and vendor lock-in. That is fine for a pilot. Zolak notes that 52% of retailers admit they are not ready to adopt AR at scale, which makes a low-commitment SaaS pilot on 10 to 50 high-value SKUs a sensible first move before any custom build. Early movers still have room to differentiate here.
Custom WebAR and Native App Development
Custom development splits into two paths with very different price and timeline profiles. Custom WebAR runs $25,000 to $75,000 and ships in 6 to 16 weeks, built on frameworks like 8th Wall, A-Frame, or AR.js and delivered straight to the mobile browser with no app store. Native AR apps run $50,000 to $300,000+ over 6 to 12 months, using ARKit and ARCore through Unity or Unreal for deeper device integration.
| Delivery method | Typical cost | Timeline | Best fit |
|---|---|---|---|
| SaaS WebAR | $140–$500/month | Days | Pilots, small catalogs |
| Custom WebAR | $25,000–$75,000 | 6–16 weeks | Branded campaigns, broad reach |
| Native AR app | $50,000–$300,000+ | 6–12 months | Flagship feature in an existing app |
Lighter custom WebAR builds can start nearer $8,000 to $40,000, per Virtual Verse Studio’s 2026 cost breakdown. Budget another 15% to 25% of the build cost per year for maintenance. Our WebAR development and AR mobile app development pages detail what sits inside each path.
3D Modeling: Often the Largest Line Item in the Budget
The 3D models, not the AR software, usually dominate an ecommerce AR budget. Mohamed Essam, Co-Founder and CTO of Virtual Verse Studio, states that 3D content “can consume more than two-thirds of an AR budget” for visually rich applications. A single photorealistic, optimized model runs $100 to $1,000+ per SKU depending on complexity, per Q99 Studio’s 2026 cost guide.
Run that math across a catalog and the risk becomes obvious. A 500-SKU rollout at $200 per model is $100,000 in assets alone, before a line of AR code. This is why sequencing matters: model your highest-traffic hero products first, prove the conversion lift, then expand. Feature-level cost guidance from DesignRush’s 2026 AR cost breakdown puts 3D modeling and rendering at $5,000 to $30,000 as a project line, which tracks with per-SKU pricing once volume climbs.
AI generation is compressing the timeline. Neural4D reports a base mesh in roughly 90 seconds and a fully textured GLB in about two minutes, though production-grade hero assets still need human retopology and material work. Our 3D modeling services page covers where automation helps and where it does not.
Need help building AR product visualization?
We are here to help!
How Does the 3D Model Pipeline Work for Ecommerce AR?
The ecommerce AR pipeline turns a physical product into an AR-ready asset in four steps: model the product, optimize the mesh, export to both AR formats, and QA on real devices. Each step has a failure mode that shows up later as a broken or slow AR experience, so the discipline in this pipeline is what separates a viewer that converts from one that frustrates.
Step 1 — Modeling the Product
Modeling produces an accurate 3D master of the product with correct geometry, materials, and dimensions. Three routes exist. Photogrammetry reconstructs a model from 30 to 50 photographs. CAD conversion retopologizes an existing engineering model for real-time use. Manual modeling builds the asset in Blender or Autodesk Maya from reference photos and physical samples.
Hero products earn manual modeling for dimensional precision; large catalog rollouts lean on photogrammetry or AI generation. Dimensions must match the physical product exactly, because AR renders at 1:1 scale and a mis-sized model breaks shopper trust on the first placement. Physically-based rendering (PBR) materials, including albedo, metallic, roughness, and normal maps, are applied at this stage.
Step 2 — Optimizing the Mesh for Mobile AR
Optimization makes the model light enough to load and render smoothly on a phone without visible quality loss. Retopology cleans the geometry, removes internal faces, and sets a correct pivot point for stable AR anchoring. The polygon budget runs 20,000 to 300,000 triangles depending on product complexity, per Neural4D’s 2026 guidance, with textures at 2048×2048 pixels for most products.
Compression is the difference between a 2 MB model and a 20 MB one. Draco mesh compression cuts geometry size roughly 5:1 without quality loss, and KTX2 with Basis Universal encoding shrinks textures further. 360 Render’s 2026 format guide recommends final GLB files under 5 MB and warns that files above 15 to 20 MB create “real usability problems on mobile.” Level-of-detail (LOD) variants keep distant renders cheap.
Step 3 — Exporting as USDZ and glTF/GLB: Why You Need Both
Ecommerce AR requires two export formats because Apple and Google use different ones, and there is no single file that serves every device. glTF/GLB is the open web standard that runs in all major browsers, Google’s Android Scene Viewer, and the Shopify model-viewer component; use it for Android and desktop. USDZ is Apple’s format for iOS AR Quick Look; it triggers natively in Safari on iPhone and iPad with no app.
Both files come from the same 3D master. On Shopify, uploading a GLB and its paired USDZ lets the platform auto-detect the device and serve USDZ to iOS or GLB to Android from a single product entry, as Neural4D’s Shopify 3D guide documents.
The trap is treating dual export as a one-click conversion. Materials can render differently between USDZ and GLB, so a metallic finish that looks right on Android can look flat on iOS. This is why the pipeline ends with human visual QA on physical iPhones and Android phones, not a passing export log.
WebAR vs. Native App for AR Product Visualization
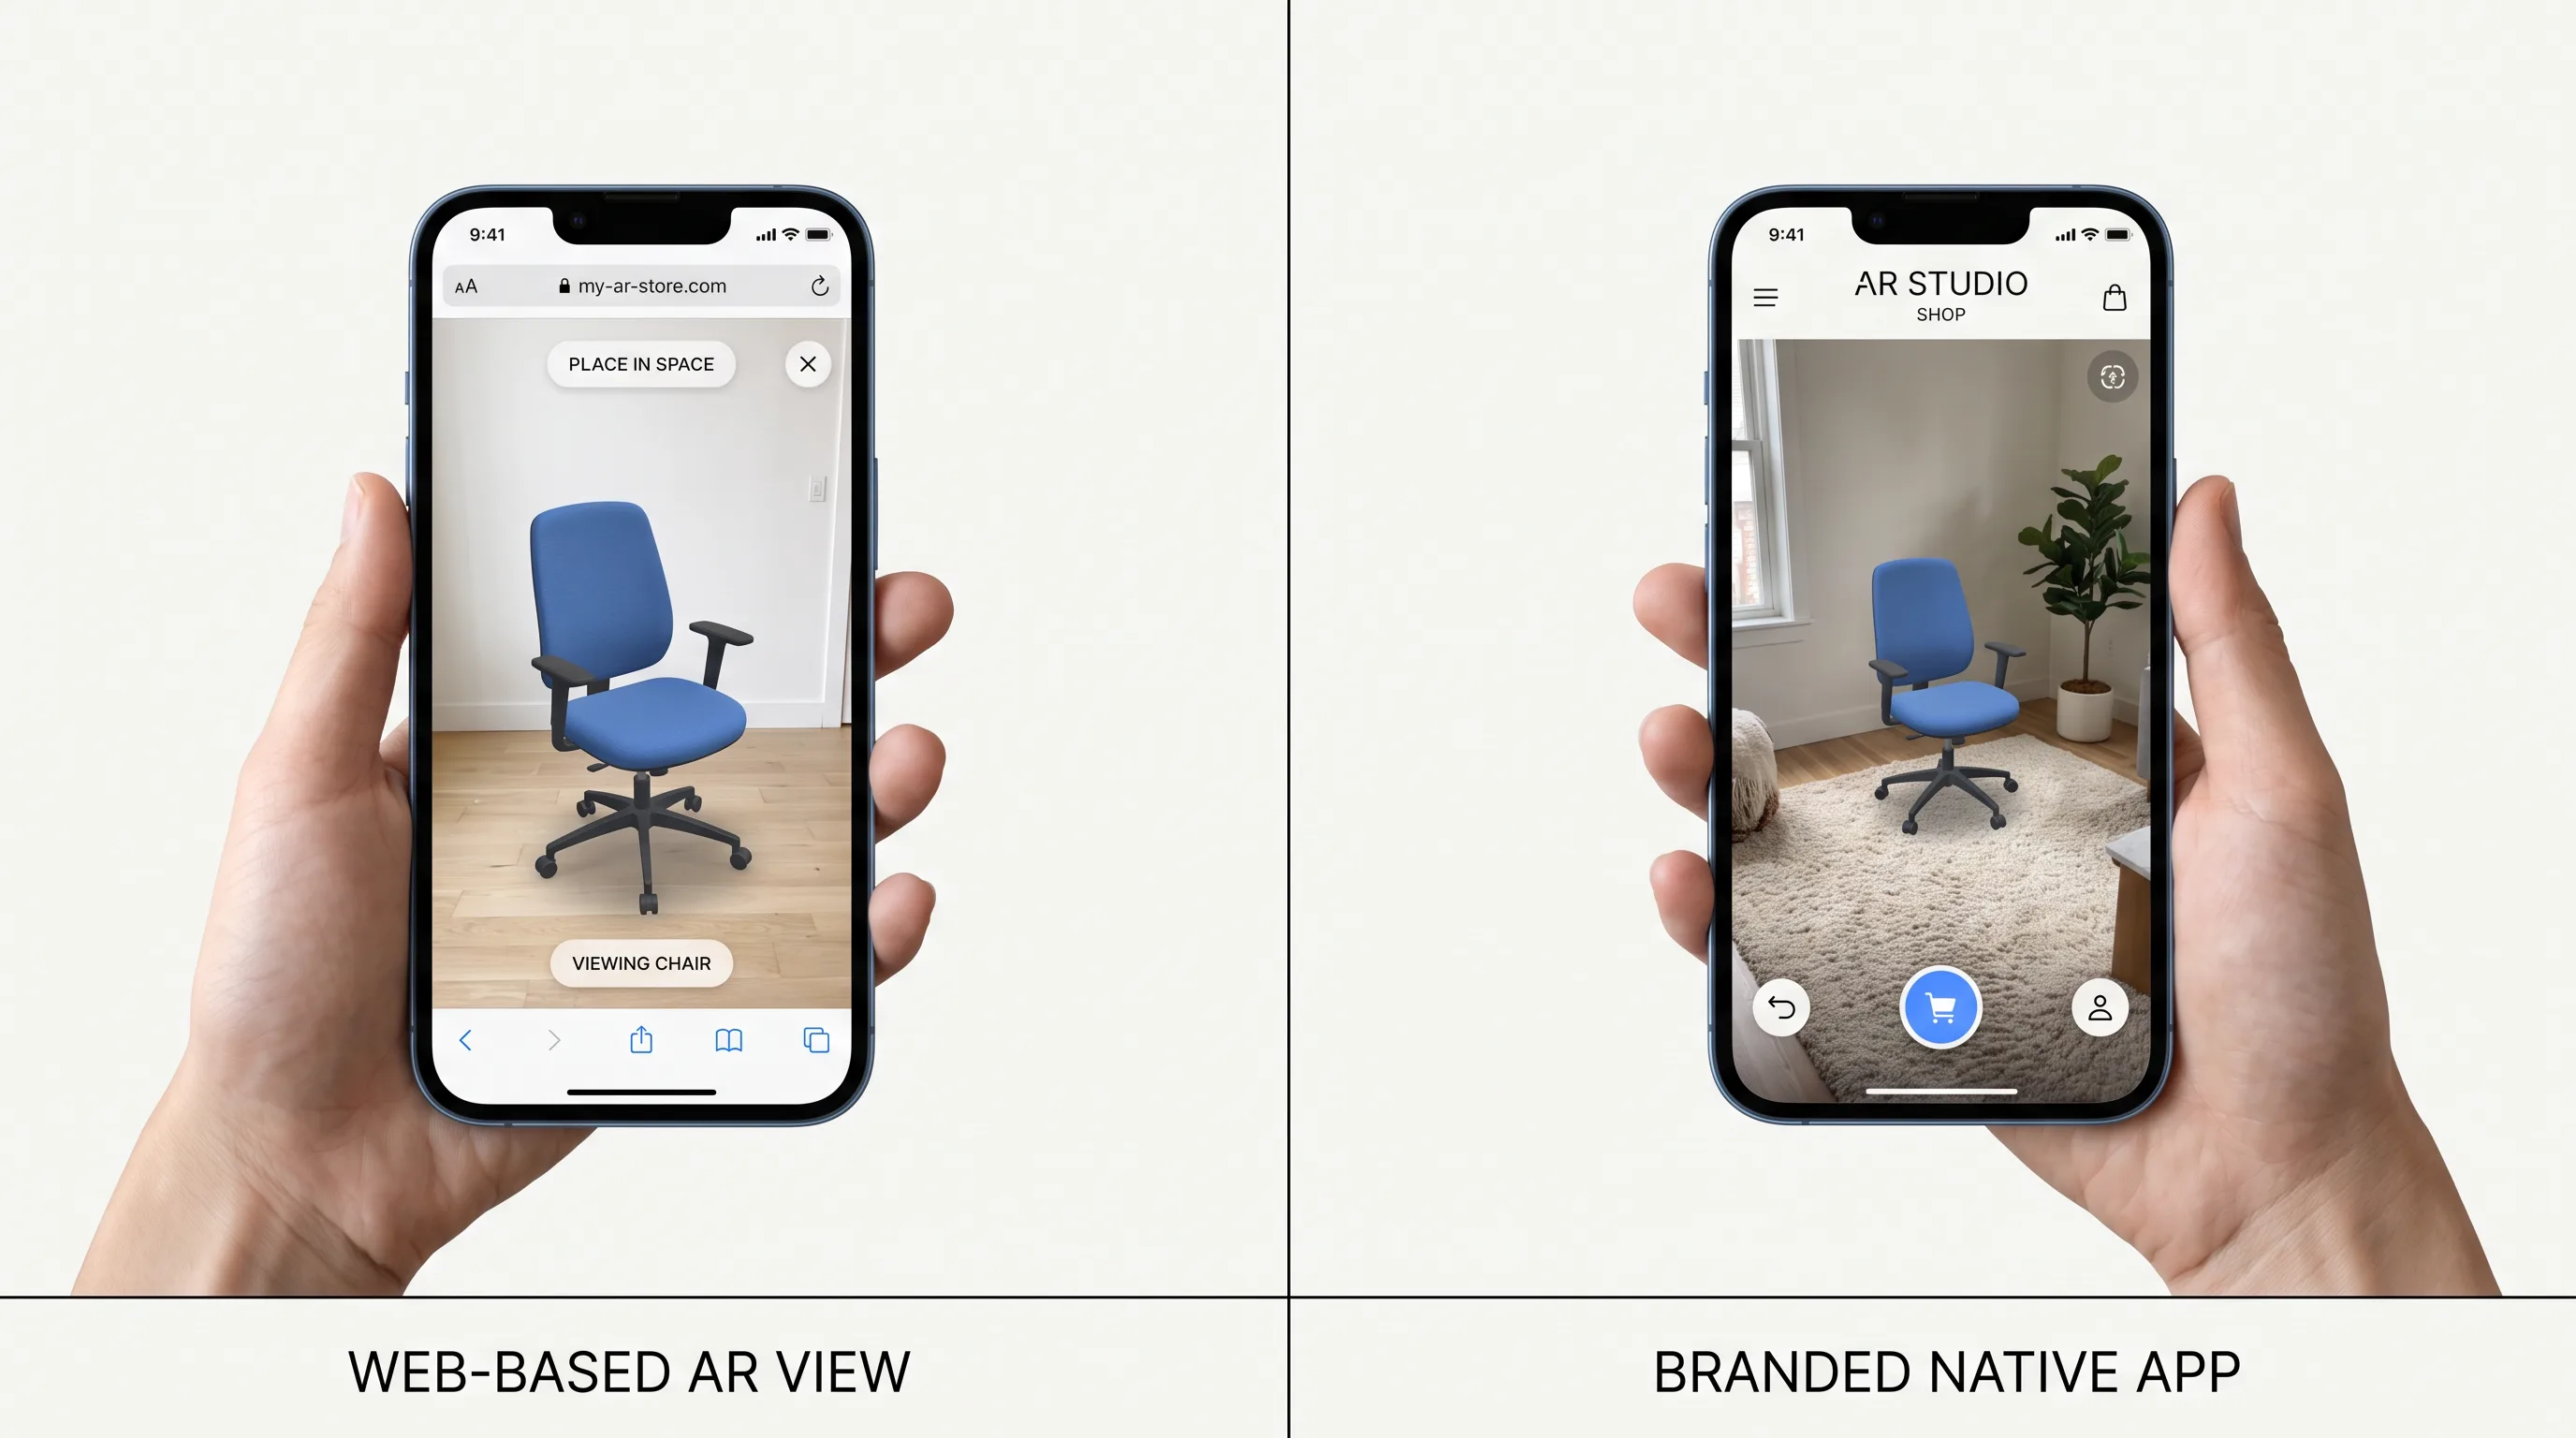
WebAR wins on reach and speed; a native app wins on performance and repeat engagement. WebAR runs in the browser with zero download, ships in days to weeks, and reaches any shopper with a link or QR code. A native app requires an install but delivers device-optimized rendering, richer interaction, and a permanent home for AR inside a brand’s existing shopping app.

| Factor | WebAR | Native app |
|---|---|---|
| Speed to market | Days to weeks | 6–12 months |
| Upfront cost | $8k–$75k, or $140–$500/mo SaaS | $50k–$300k+ |
| User friction | None — browser only | App download required |
| Performance | Variable by browser | Superior, device-optimized |
| Best use | Campaigns, broad reach, first deployment | Existing app, flagship repeat feature |
The frameworks differ accordingly. WebAR builds on 8th Wall, A-Frame, AR.js, and Apple’s USDZ-only AR Quick Look; our WebAR frameworks and best practices guide compares those stacks on tracking, load time, and iOS support. Native builds use ARKit, ARCore, Unity3D, and Unreal Engine. One cost note worth internalizing: WebAR is “not automatically cheaper to engineer than a comparable native application,” per Virtual Verse Studio’s 2026 analysis. Its cost advantage comes from distribution, since there is no app store submission, not from less engineering.
Verdict: Choose WebAR for product launches, seasonal campaigns, and any brand deploying AR for the first time; choose a native app when AR is a permanent flagship feature inside an app shoppers already use. For a fuller spatial commerce build, our AR/VR app development service covers both delivery paths.
What to Look for in an AR Product Visualization Development Partner
The right AR partner controls the full chain from 3D asset to shipped experience and proves outcomes with data, not screenshots. Because 3D production is the largest cost and the most common failure point, the single most important question is whether the studio builds and optimizes assets in-house or brokers them out to a separate vendor. Outsourced assets mean divided accountability when a model loads slowly or renders wrong.
Five criteria separate a capable studio from a risky one:
- In-house 3D pipeline. Modeling, optimization, and the AR build under one roof, so no finger-pointing between an asset shop and a dev shop.
- Cross-platform delivery. USDZ and glTF/GLB, ARKit and ARCore, WebAR and native, rather than a single-platform specialist.
- Ecommerce integration. Real experience with Shopify model-viewer, platform CMS, and asset management for multi-SKU catalogs.
- Analytics from launch. Session duration, interaction rate, and conversion paths instrumented from day one.
- Measurable case studies. Before-and-after conversion and return-rate data you can inspect.
Frame Sixty, an AR/VR and spatial computing development studio, runs this pipeline end to end. Our 3D team models in Blender and Autodesk Maya, textures in Substance Painter and Substance Designer, and builds retopology, UV layout, and LOD generation into the standard workflow. We export a single master to both glTF/GLB and USDZ, apply Draco compression to hold GLB files inside the sub-5 MB target, and QA every asset on physical iOS and Android hardware before it goes live, because that is where automated dual-format conversions quietly break.
On the delivery side, Frame Sixty is an official 8th Wall partner and Unity Certified, and we build WebAR for the browser and native AR on ARKit and ARCore. Across shipped work the team counts 10M+ downloads, 100+ apps and AR experiences, and 7 published AR and machine-learning patents, recognized as a Clutch Top AR/VR company in the US. You can review our portfolio and case studies and the wider XR development agency capabilities before starting a conversation.
If you are scoping a project, our augmented reality development services cover strategy through deployment, and the AR solutions overview shows the full range beyond product visualization.
Conclusion
AR product visualization is a proven ecommerce lever, not an experiment. Shopify data shows a 94% conversion lift, named cases like IKEA Place show a 189% jump, and documented programs cut returns up to 40%. The numbers are strong enough that the question for most brands is no longer whether to build AR, but how to build it so the asset quality matches the ambition.
That is the position worth defending: the AR wrapper is the easy part, and the 3D asset is where projects succeed or fail. Model your products accurately, optimize the mesh under 5 MB, export to both USDZ and glTF/GLB, and test on real devices. Start with a pilot on your hero SKUs, measure conversion and returns, then scale by traffic. A studio that owns the whole pipeline protects you from the divided accountability that sinks so many AR rollouts.
Ready to add AR product visualization to your store? Get in touch with our team at Frame Sixty, and we will scope the 3D pipeline, delivery method, and timeline around your catalog and your conversion goals.
FAQs
Common questions about AR product visualization for ecommerce — what it costs, how the 3D pipeline and file formats work, and how to get it live on your store.
AR product visualization places a true-to-scale 3D model of a product into the shopper's room, so a sofa or speaker appears on their own floor or desk. AR try-on instead tracks a face or body to place glasses, makeup, or apparel on the shopper. Visualization answers "will it fit my space"; try-on answers "will it fit me."
Furniture, home goods, and appliances gain the most from AR product visualization, because the gap between a flat photo and the physical object is widest for high-consideration items placed in a room. Electronics, decor, and fashion accessories also benefit. IKEA Place, a furniture example, drove a 189% conversion lift for AR users.
AR product visualization reduces returns by up to 40%, per Shopify and Deloitte data, by letting shoppers preview accurate scale, color, and finish before buying. Because the model renders at 1:1 scale in the buyer's own space, it prevents the "it didn't fit or didn't look like the photo" returns that drive reverse-logistics cost.
Apple AR Quick Look is iOS's built-in AR viewer that renders a USDZ model natively in Safari on iPhone and iPad, with no app to install. A shopper taps a link and the product anchors to their floor or table at true scale. Ecommerce AR must supply a USDZ file to reach Apple devices.
Google Scene Viewer is Android's native AR viewer that renders a glTF/GLB model in the browser, letting shoppers place a product in their space without an app. It reads the open glTF/GLB standard rather than Apple's USDZ, which is why ecommerce AR needs both formats to cover Android and iOS from one product page.
Yes. WebAR delivers AR product visualization straight to the mobile browser through a link or QR code, with no app download, using frameworks like 8th Wall, A-Frame, and AR.js. On iOS it runs through AR Quick Look and on Android through Scene Viewer. Hosted SaaS viewers start near $140 to $500 per month.
To add AR product visualization to Shopify, upload a GLB model and its paired USDZ file to a product; Shopify's model-viewer component then auto-detects the device and serves USDZ to iOS AR Quick Look or GLB to Android Scene Viewer from a single entry. Keep the GLB under 5 MB for fast mobile loading.
Look for a studio that controls the full chain from 3D asset to shipped experience, since 3D production is the largest cost and the most common failure point. Key criteria are an in-house 3D pipeline, cross-platform USDZ and glTF/GLB delivery, Shopify integration, analytics from launch, and measurable case studies. Frame Sixty runs this pipeline end to end and QAs assets on physical iOS and Android hardware.
A custom WebAR build for AR product visualization typically ships in 6 to 16 weeks, while a native AR app takes 6 to 12 months. Hosted SaaS viewers can go live in days. Timeline depends mainly on catalog size, because each SKU needs its own optimized 3D model, often the longest lead item.