
What Is a 3D Configurator? Build vs. Buy, Real Costs, and How to Choose
Sep 1, 2026


16 MIN READ
A 3D configurator is an interactive, browser-based tool that lets a shopper change a product’s color, material, finish, and components in real time and see every choice rendered live in 3D. It runs on WebGL with no plugin to install, and it turns a static product page into a decision engine. For configurable products, it measurably lifts conversion and cuts returns.
This guide covers what a 3D configurator does, the ROI it delivers, what it actually costs, and the decision that trips up most buyers: whether to license a SaaS platform or commission a custom build. It closes with the technology tradeoffs and how to judge a build partner. If you want the service-level detail on our own work, see Frame Sixty’s 3D product configurator development page.
Here is the position this guide argues and returns to at the end: for any configurator that is core to your brand and expected to run more than two years, a custom build beats enterprise SaaS on total cost, and the license fees usually cross the build price by year two.
Key Takeaways
- A 3D configurator lets shoppers customize products in real time; products with 3D/AR content convert 94% higher than flat images (Shopify merchant data, 2026).
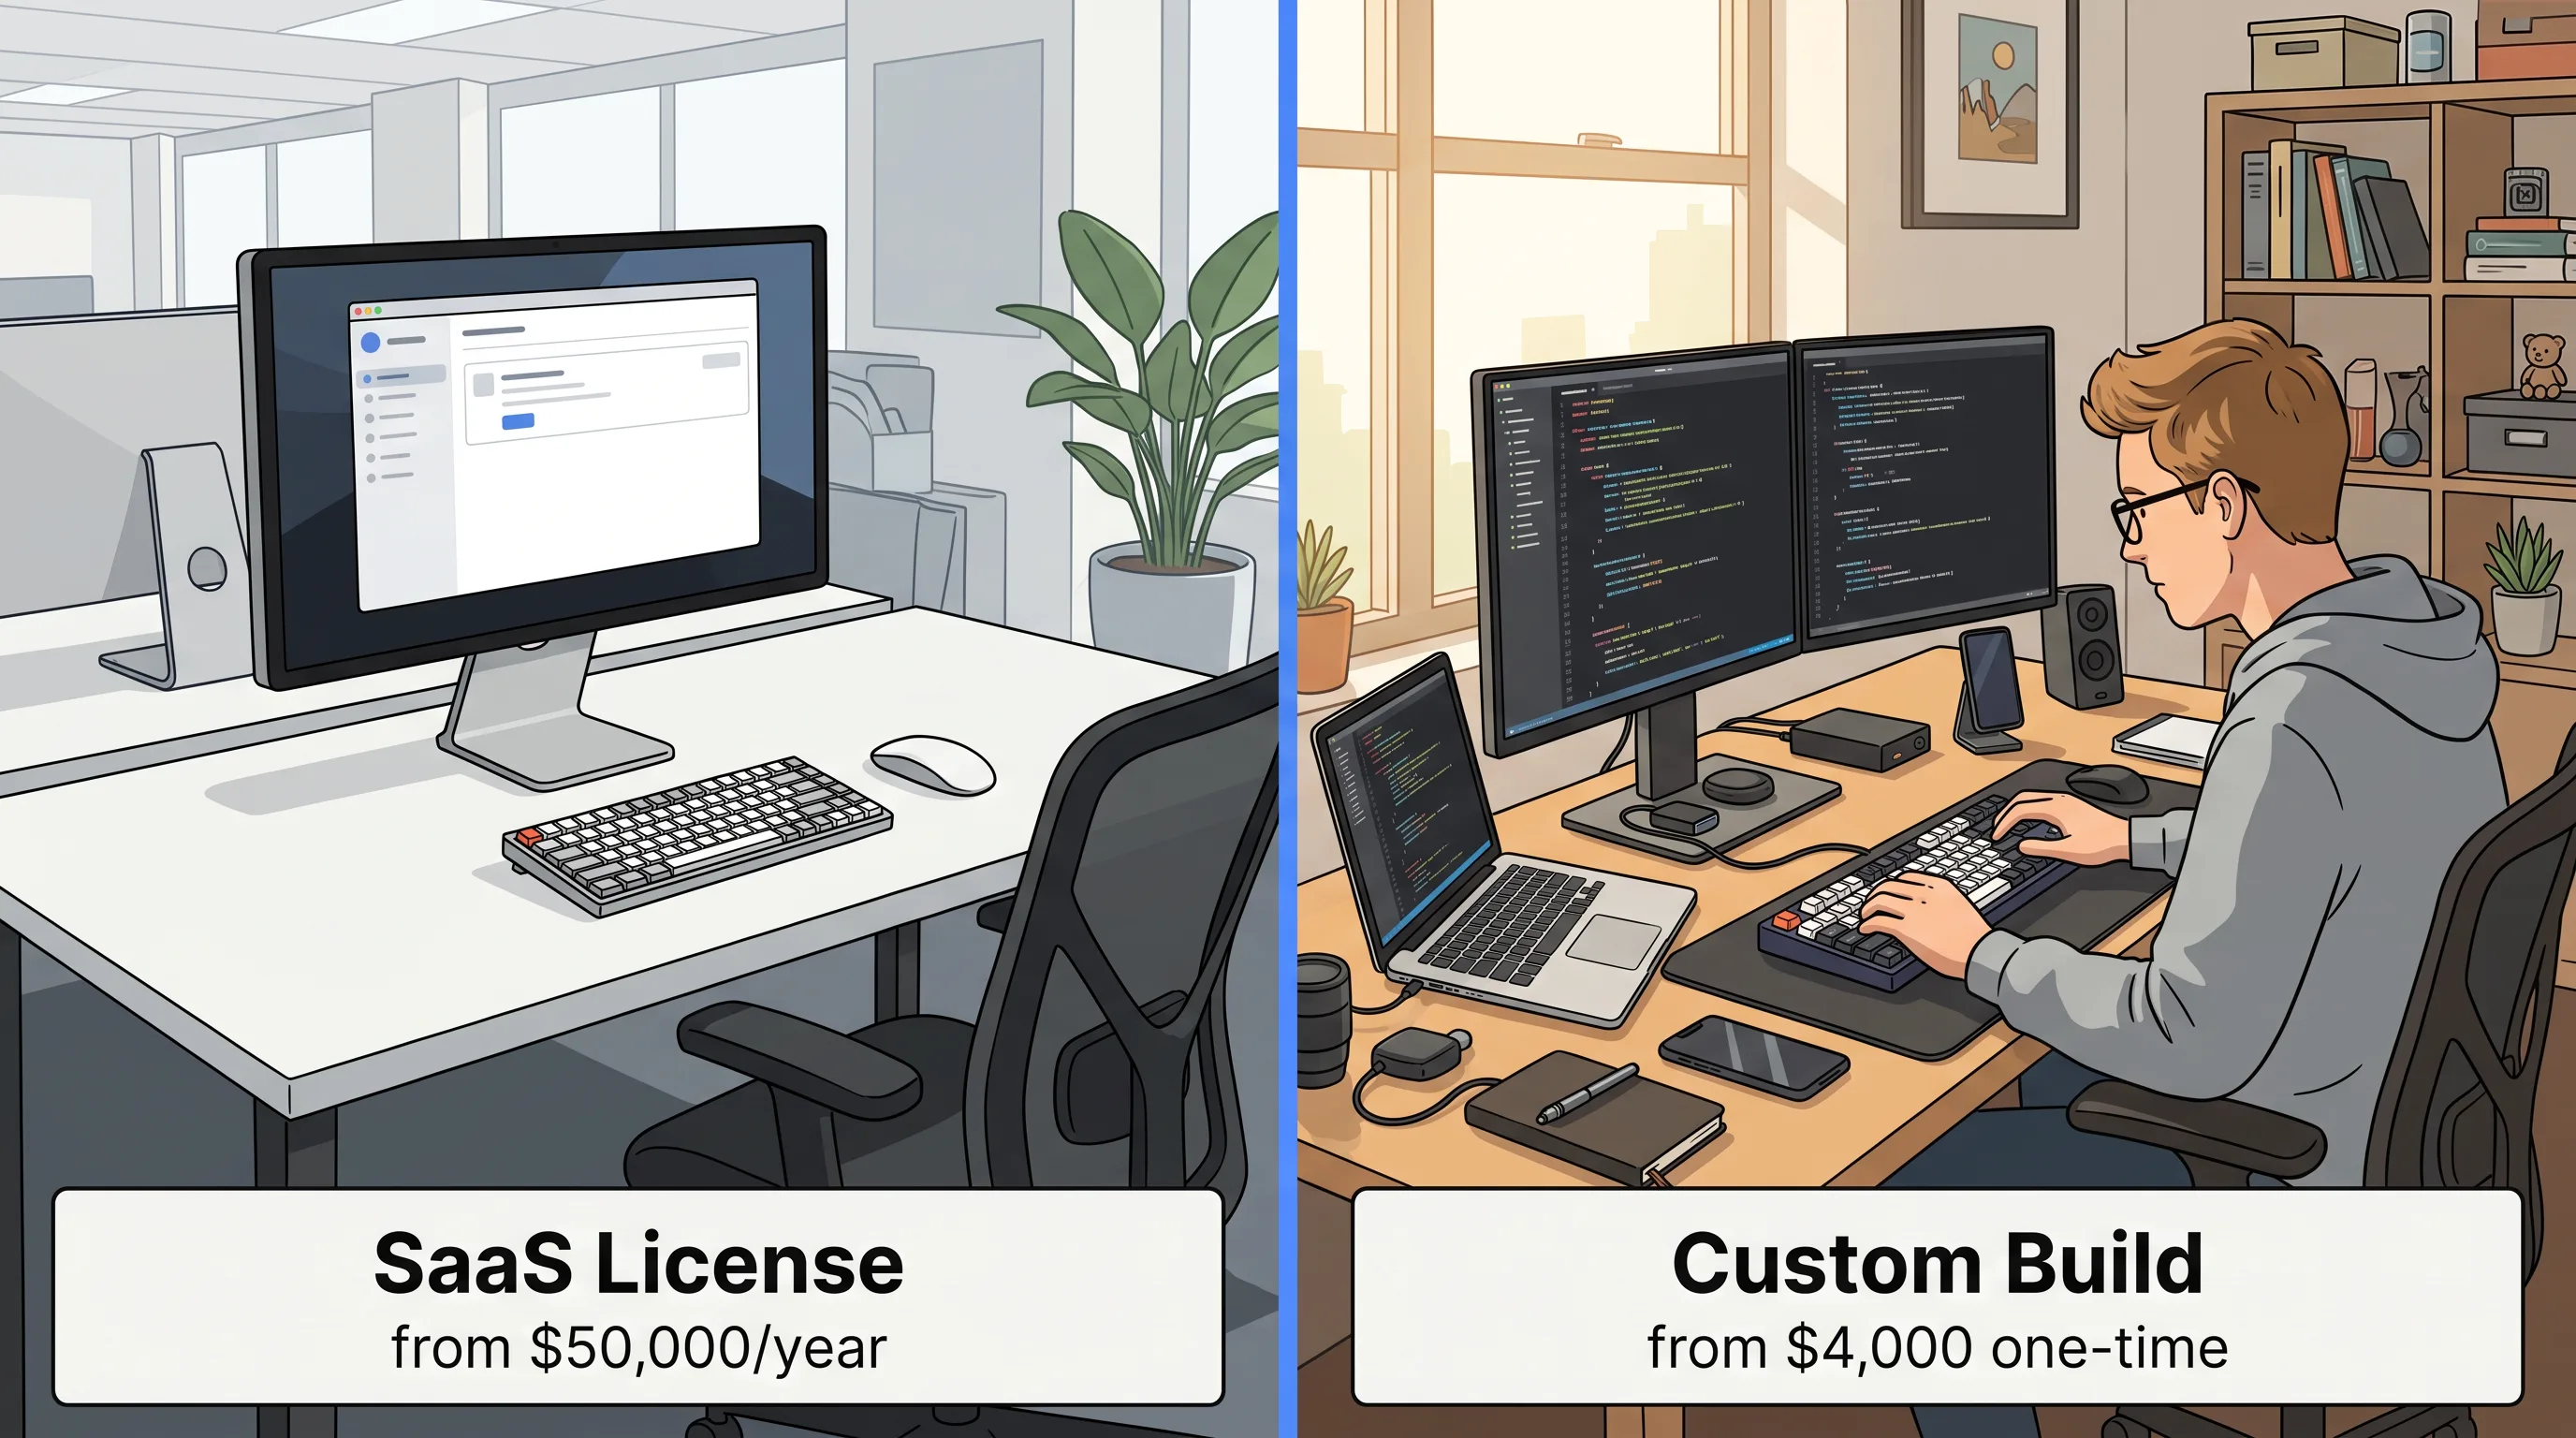
- SaaS platforms range from $29/month (Zakeke) to $50,000–$150,000+/year (Threekit); custom builds run $4,000–$150,000+ one time.
- Enterprise SaaS year-three cost reaches €220,000–€700,000+, versus a one-time custom build — the crossover favors custom by year two for brand-critical tools.
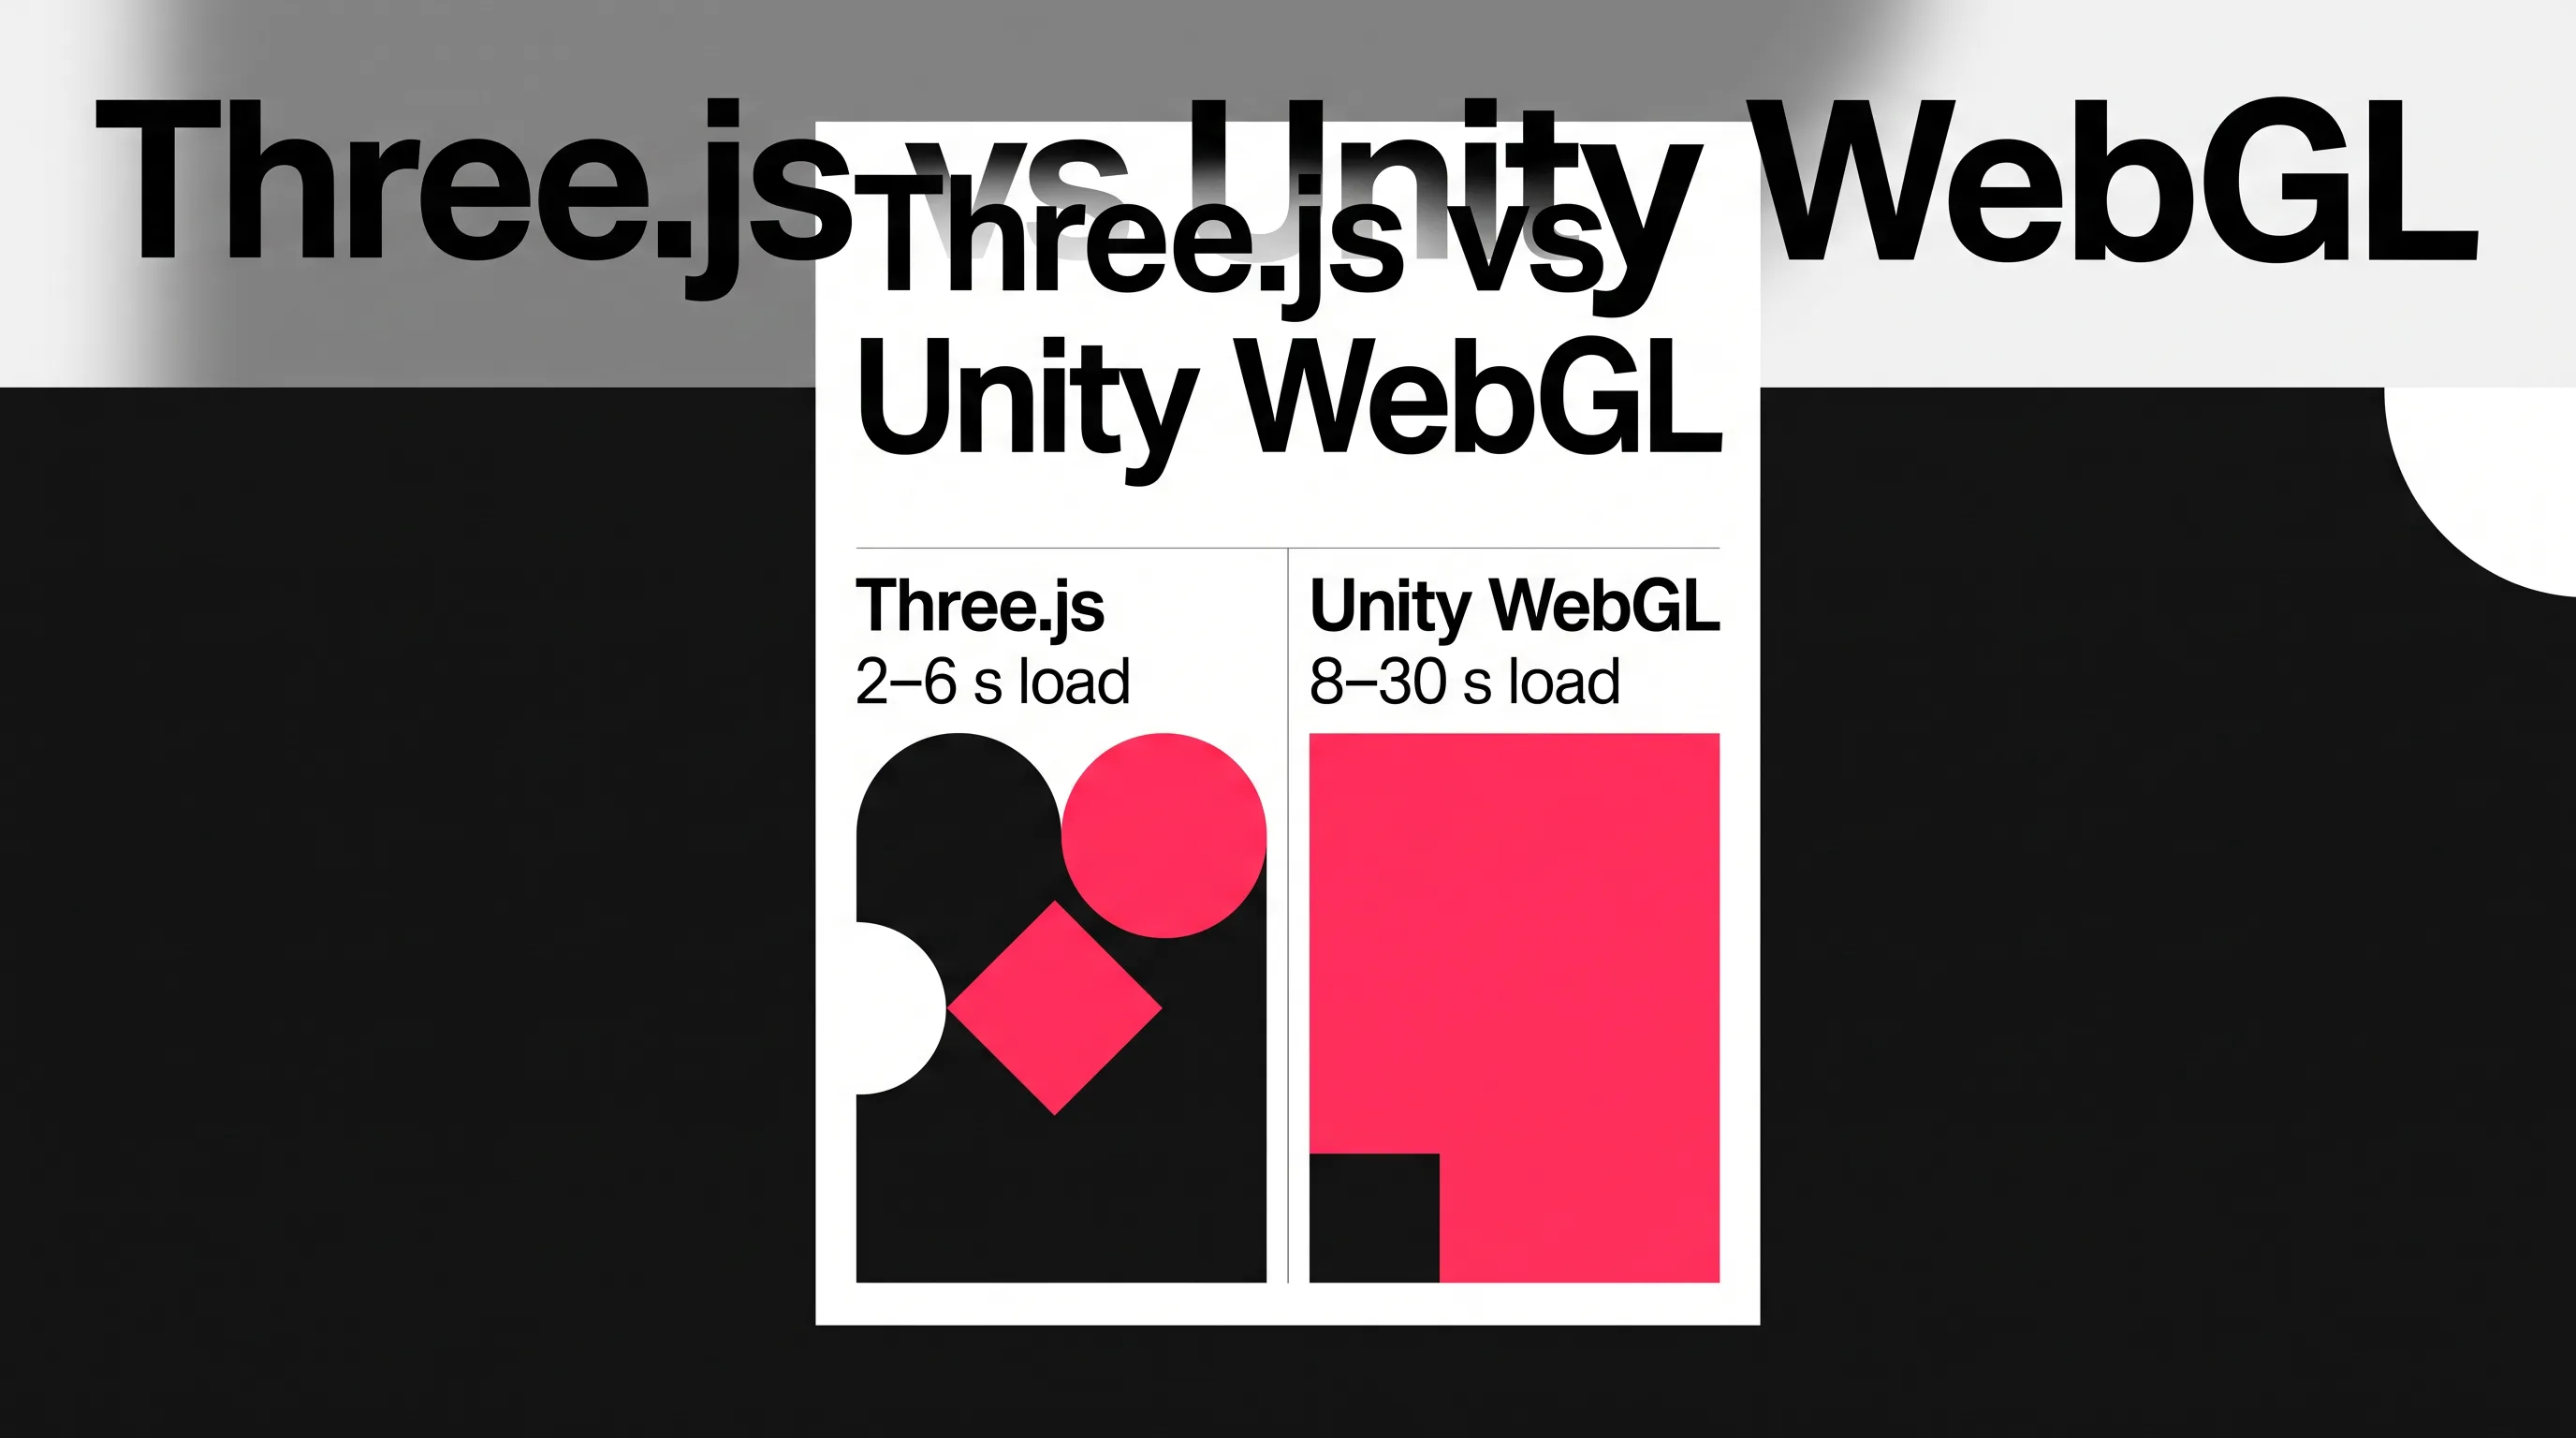
- Three.js loads a configurator in 2–6 seconds at 500 kB–1 MB; Unity WebGL takes 8–30 seconds at 5–25 MB, hurting SEO.
- Asset preparation, not rendering, is the longest phase; 3D models cost $140–$1,500 per SKU and can take 4–12 weeks for a mid-size catalog.
What Is a 3D Configurator?
A 3D configurator is a web application that displays a product as a real-time 3D model and lets the user change its attributes — color, material, size, hardware, modular components — with the model updating instantly in the browser. It renders through WebGL, needs no app download, and loads 3D assets in glTF or GLB format. The output is a personalized product the shopper can rotate, zoom, and often place in their room.
The distinction that matters: a 3D configurator is not a spinning image gallery or a pre-rendered video loop. Those play back fixed frames. A configurator computes the view on the fly from a live 3D scene, so the number of possible combinations is effectively unlimited without pre-producing a single extra image.
Configurators now run across furniture, automotive, industrial equipment, apparel, and marine. London Dynamics documents deployments spanning marine (Centurion Boats), fitness equipment (Eleiko), automotive (AutoTrader Canada), and cycling (Colnago) in its 2025 roundup of real-world configurator examples. Consumer brands made the pattern familiar: IKEA Place for furniture placement, Nike By You for sneakers, Fender Mod Shop for guitars. The takeaway: if a product ships in variants, it is a configurator candidate.
What ROI Does a 3D Configurator Deliver?
A 3D configurator delivers ROI on three fronts: higher conversion, lower return rates, and higher average order value. The mechanism is simple — shoppers who see exactly what they are buying commit more often and send fewer items back. The numbers below come from named 2025–2026 studies, not vendor promises.
Conversion Rate and Return Rate Impact
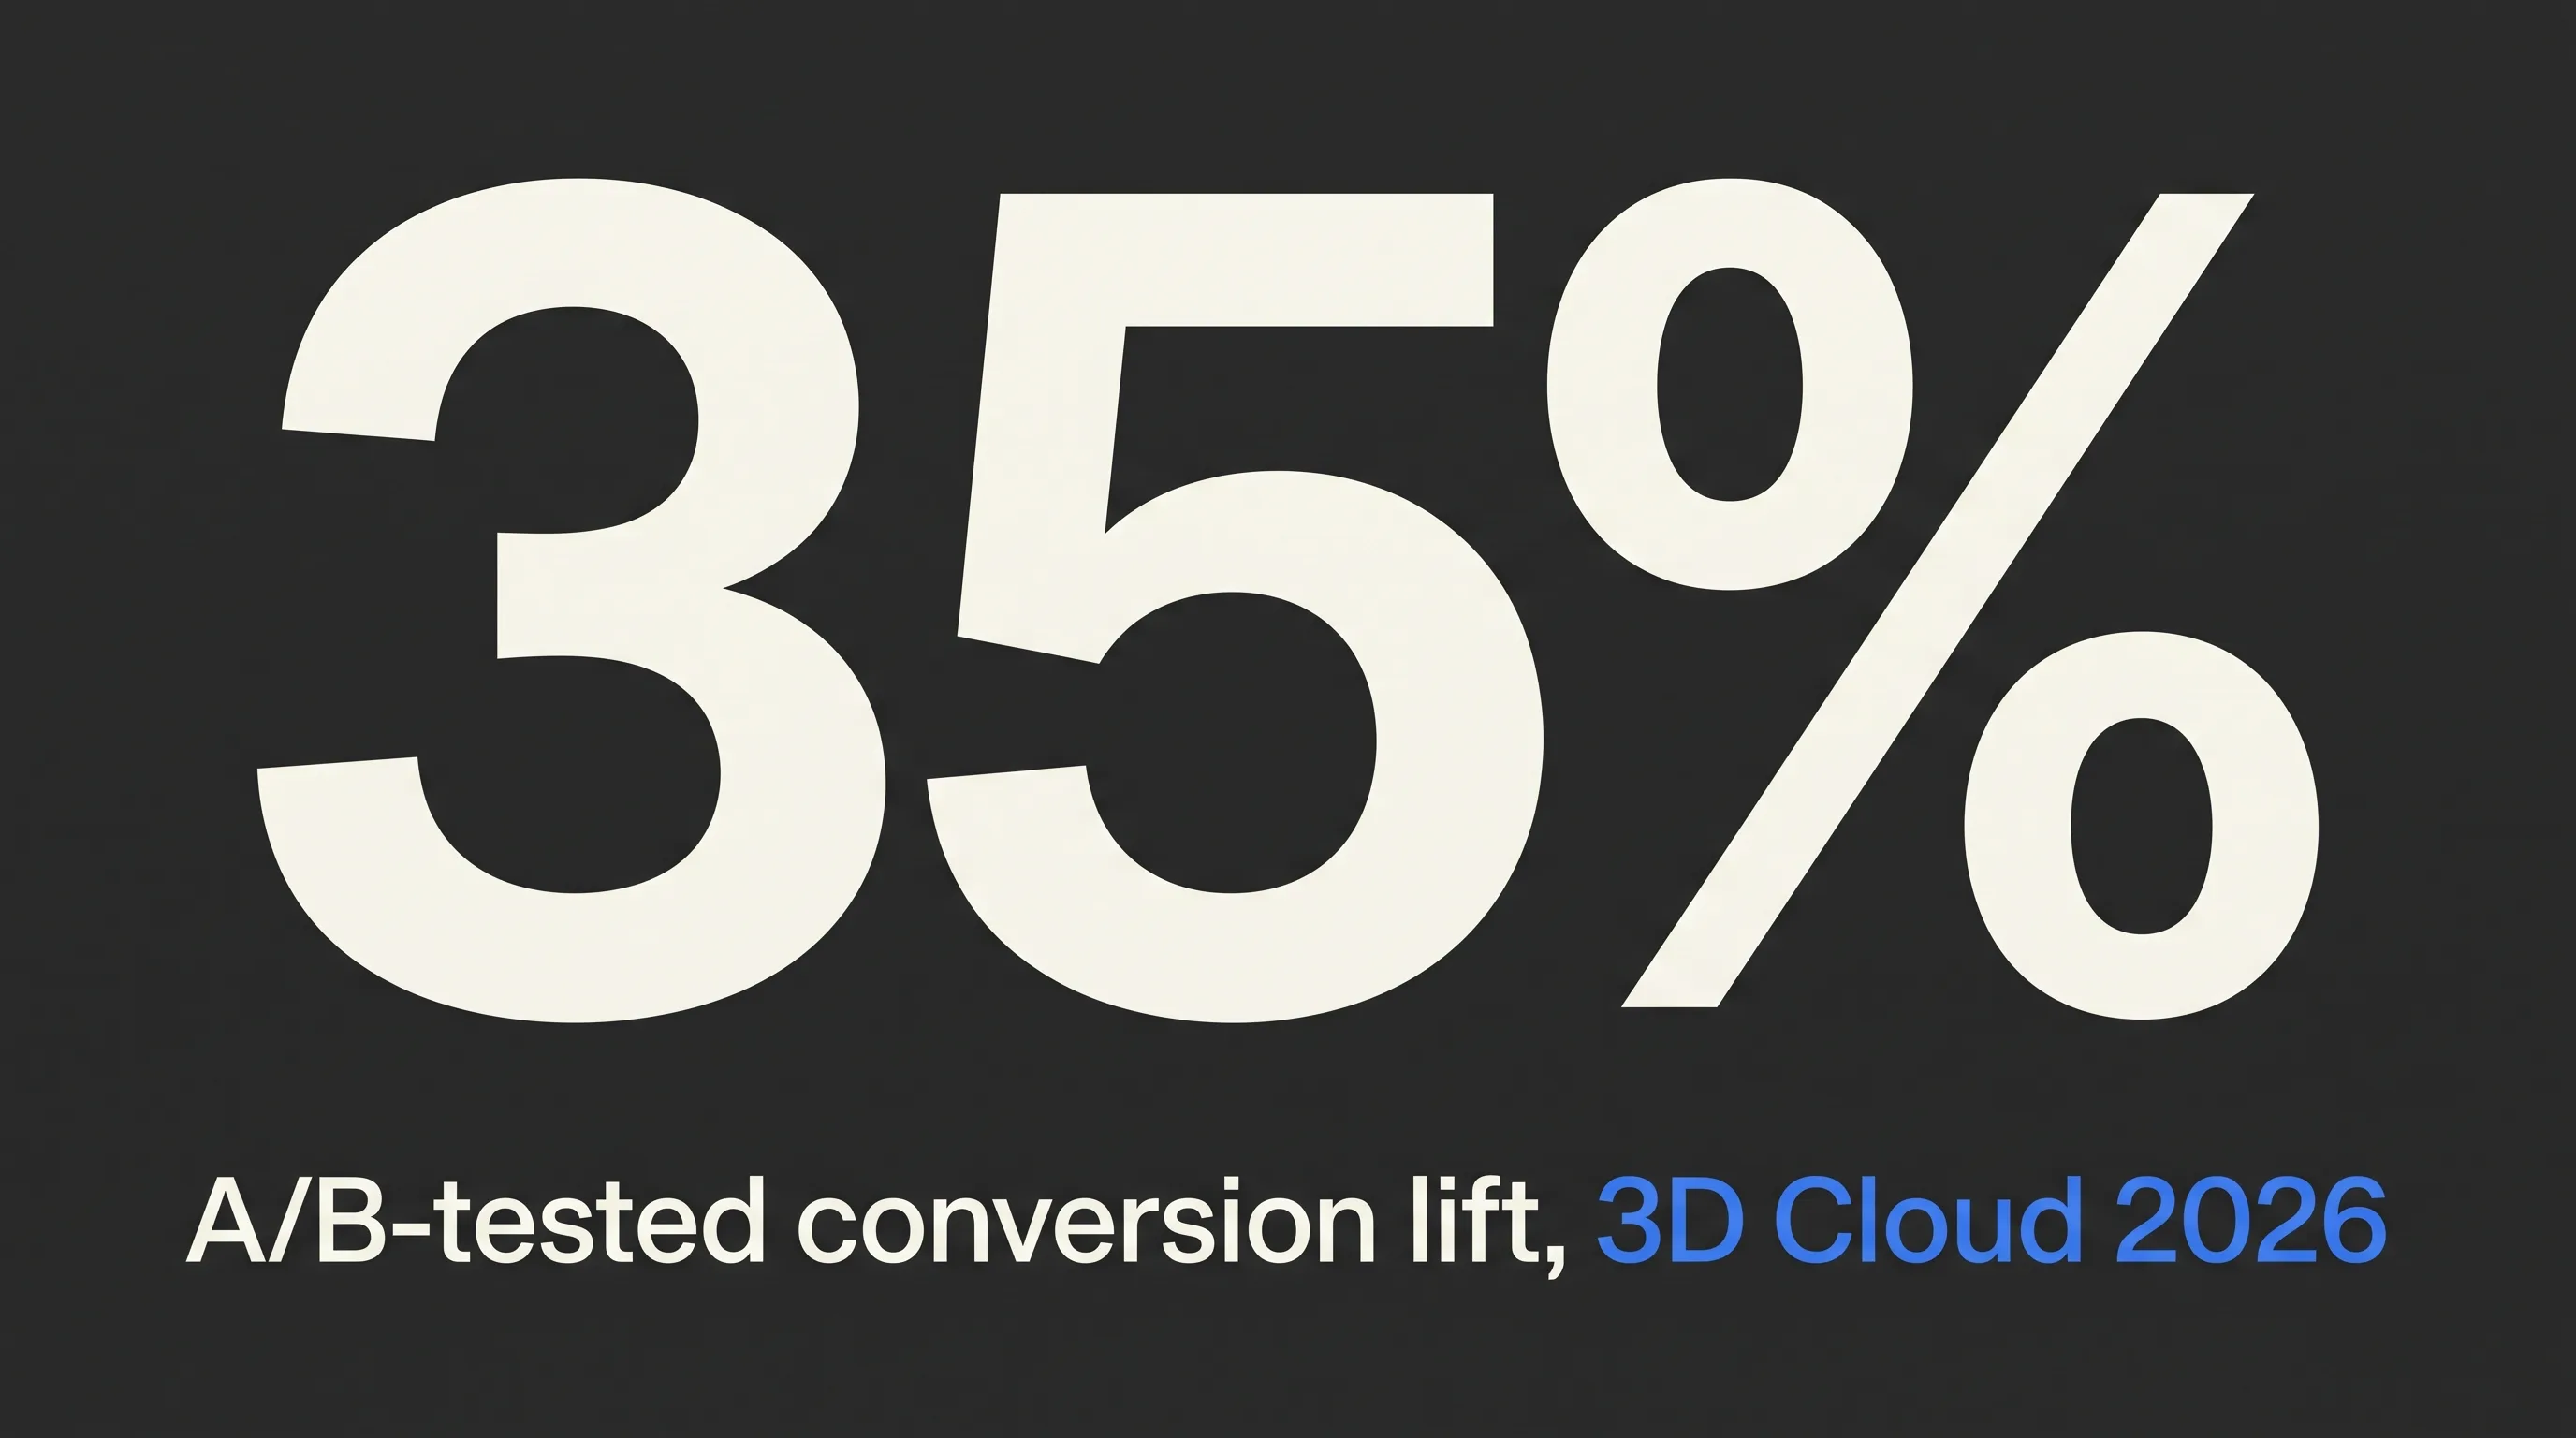
Products with 3D and AR content convert far better than flat images. According to Shopify merchant data cited by DesignRush in its 2026 3D product configurator report, 3D/AR content drives a 94% average conversion lift. A more conservative and better-controlled figure comes from 3D Cloud: a 50/50 A/B test across 220,000 product-page views at a major furniture retailer found a 35% conversion uplift for shoppers who interacted with 3D, reported in its 2026 ROI of 3D visuals analysis.
Returns move too. The 3D Cloud 3D Commerce Index for Q1 2026, covering 40 retailers with more than $10B in annual 3D commerce sales, records a 25% average return reduction from 3D room planners and a 13% interaction rate for product configurators in the same ROI of 3D visuals analysis. That matters against a 19.3% overall online return rate in 2025 — roughly $200 billion in returns — per NRF and Happy Returns data compiled by DesignRush in its 2026 3D product configurator report.
The confidence effect explains the mechanism. Eyedex’s 2025 configurator conversion case studies cite a Salsify finding that 46% of shoppers abandon a site when they cannot find engaging product content, alongside a typical 40% conversion boost and a 20–50% lift in average order value once a configurator is in place. BMW’s digital showroom configurator drove higher dealership-visit qualification rates, and West Elm reported return reductions from its AR features. Threekit’s aggregated configurator statistics add that 95% of users prefer interactive 3D to static video, though that figure traces to Cappasity research from 2022 and should be read as directional rather than current.
One caveat worth stating plainly, because most pages quoting the 94% figure do not: that number is a merchant-reported average across self-selected stores, not a controlled experiment. Treat the 35% A/B result as the number to model your business case on, and treat 94% as the ceiling a well-executed build can approach, not the expected outcome.
Revenue Lift from Real Deployments
Named deployments show where the revenue actually lands. CITY Furniture recorded a 10% increase in revenue per session on configurable pages, and Flexsteel deployed more than 400 product configurators across 1,300 dealers in under a year, both documented in 3D Cloud’s 2026 ROI report. Mott Corporation’s 3D product viewer produced a 33% increase in time on site, a 160% increase in pages per visit, and a 20% increase in sales inquiries, per DesignRush’s 2026 data.
The underlying driver is personalization. McKinsey research cited by VividWorks in its 2026 guide to building a 3D configurator finds effective personalization lifts revenue 15% and marketing ROI 30%. Beck Besecker, CEO and co-founder of 3D Cloud, puts the case bluntly: “If you sell configurable products online, 3D visual configuration isn’t a nice-to-have. It’s the cost of doing business.”
High-consideration categories show the effect most sharply. A Provoke Insights 2026 survey reported by Sayduck in its furniture configurator analysis found that 62% of furniture shoppers struggle to picture a product in their home, 73% want higher-cost purchases shown in 3D before buying, and 67% are more likely to spend $2,500 or more after seeing an item in 3D. Sonia Schechter, CMO at 3D Cloud, frames the payoff: “3D visuals can improve e-commerce ROI by helping retailers enhance conversions, reduce returns, and create product content efficiently.”
The lesson across these cases: configurators earn their return when the product has genuine variety and a purchase decision that benefits from seeing options. A one-SKU commodity will not see these numbers.
How Much Does a 3D Configurator Cost?
A 3D configurator costs anywhere from $29/month for an entry SaaS plugin to $150,000+ for a custom enterprise build with ERP integration. Three variables set the number: the approach (SaaS versus custom), catalog complexity (how many SKUs and how deep the options run), and integration scope (a standalone viewer versus a system wired into pricing and manufacturing).
SaaS Platform Licensing
SaaS 3D configurators price by subscription tier. Entry-level tools like Zakeke start around $29–$49/month. Mid-market platforms run $300–$2,000/month. Enterprise platforms such as Threekit and VividWorks sit at $50,000–$150,000+/year. CPQ3D’s 2026 pricing breakdown from 12 vendors puts year-one total deployment at €1,000–€5,000 for self-serve, €20,000–€50,000 for mid-market, and €80,000–€250,000+ for enterprise.
The figure buyers overlook is the multi-year total. Per CPQ3D, enterprise deployments reach €220,000–€700,000+ by year three, because the license never stops. Self-serve platforms stay at €3,000–€15,000 over the same window. Subscription cost is not a one-time line item; it is rent.
Custom Build Cost Ranges
A custom build is a one-time cost that scales with complexity. According to hontran.dev’s 2026 cost analysis, a single-product configurator runs $4,000–$10,000, a multi-option build with a rules engine and live pricing runs $10,000–$30,000, and an enterprise or CPQ build with ERP integration runs $30,000–$150,000+. Separate from the software, 3D model production runs $140–$1,500 per SKU, with furniture around $180–$500 and automotive $500–$1,500.
Asset creation is a real budget line, not an afterthought. The models that feed a configurator are the same assets that power renders, AR viewers, and VR demos, so the spend compounds in value. Frame Sixty covers that pipeline in its 3D product rendering services, where a single production model is built once and reused across every channel.
Put the two cost curves together and a break-even appears that neither pricing source states outright. A $40,000 custom multi-option build is a fixed cost. A mid-market SaaS platform at €20,000–€50,000 per year passes that build price inside year one to year two, and keeps charging. For a configurator you expect to run three or more years, custom is usually the cheaper path — which is exactly the stance this guide opened with.
What Drives Cost Up
Five variables move a configurator’s cost more than any other. The number of SKUs and the depth of variants come first — a 5-product catalog is a different project from a 500-product one. The rest follow:
- Asset quality: CAD-to-glTF conversion, level-of-detail (LOD) setup, and physically-based rendering (PBR) materials.
- Rendering approach: real-time GPU rendering versus cheaper pre-rendered image sets.
- Integration depth: a standalone viewer versus live ERP pricing and inventory sync.
- AR try-in: adding “see it in your space” placement on mobile.
Watch the hidden costs too. CPQ3D flags €200–€500 per 3D model update, per-environment licensing that can double fees for staging plus production, and 90-day auto-renewal notice windows on SaaS contracts. Model the second and third year before you sign, not just the first.
Need help scoping a 3D configurator?
We are here to help!
SaaS or Custom Build: Which Is Right for Your Business?
SaaS fits teams that need a configurator live fast for standard products; a custom build fits brands where the configurator is a differentiator or the logic is complex. The decision turns on three things: how unique your configuration rules are, how tightly the tool must integrate, and how long you expect to run it. Below is how each side wins.
When SaaS Is the Right Call
SaaS is the right call when speed and simplicity outrank control. It wins when you need the tool live in weeks, your products swap color and material without deep interdependent rules, and you are already on Shopify or WooCommerce and want a plug-in path. Zakeke suits SMB and mid-market stores, Roomle targets furniture, and Threekit serves the enterprise end.
The honest framing: choose SaaS when the configurator is a utility rather than the story. If a generic embedded viewer with your logo is acceptable, and your catalog sits under 100 SKUs, paying a subscription to skip the build is a rational trade. You are renting maintenance, hosting, and updates along with the software.
When a Custom Build Wins
A custom build wins when the configurator is central to the brand or the logic exceeds what a templated platform allows. It is the right choice when configuration rules are interdependent, when live pricing must generate quotes or manufacturing files, and when the same 3D asset has to run on the web, a mobile AR view, and a trade-show headset without being rebuilt three times.
That last point is where studios earn their fee and SaaS quietly fails. A configurator built as a real-time scene can be repurposed into a WebAR experience, a Vision Pro walkthrough, and a sales-enablement app from one asset library. A SaaS platform locks the asset inside its runtime, so every new channel becomes a new subscription. Frame Sixty builds configurators as custom product configurators precisely so the underlying assets stay reusable across channels.
Connecting to Your Ecommerce Platform and ERP
Integration is often the real deciding factor between SaaS and custom. SaaS platforms ship pre-built connectors for Shopify, WooCommerce, and Salesforce CPQ, which is enough for storefront personalization. They struggle when configuration choices must pull live pricing from an ERP, check real inventory, or generate a bill of materials for the factory floor.
A custom build exposes an API and can sync inventory, trigger quote workflows, and output CAD or cut-sheets on order — the Configure-Price-Quote (CPQ) pattern that industrial and B2B sellers depend on. For enterprises wiring a configurator into PLM, ERP, and CRM systems, Frame Sixty details that work in its augmented reality solutions overview.
Verdict: Choose SaaS for a fast launch of standard products under 100 SKUs on an existing storefront; choose a custom build when the configurator is brand-critical, the rules are complex, integration runs into your ERP, or you expect to run it past two years.
How Long Does It Take to Build a 3D Configurator?
A 3D configurator takes anywhere from a few days to a year to launch, and the deciding factor is rarely the software — it is the 3D assets. A SaaS plugin with ready models can go live in hours; a custom enterprise build with ERP integration can run past a year. Discovery and planning alone typically take 2–4 weeks.

Timelines by Approach
Implementation timelines cluster by approach. VividWorks and other 2026 build guides put the ranges as follows:
| Approach | Typical Timeline | Best For |
|---|---|---|
| SaaS app (e.g. Zakeke on Shopify) | Hours to days | Standard products, fast launch |
| Platform-based with existing assets | 2–6 weeks | Mid-size catalogs, limited custom logic |
| Custom developer build (Three.js/Unity) | 2–4 months | Brand-critical UX, complex rules |
| Enterprise/CPQ with ERP integration | 6–12+ months | Manufacturing output, live pricing |
The pattern: every step you add — custom logic, live pricing, ERP sync — moves you down the table. Set expectations by the row you actually need, not the one at the top.
Why Asset Preparation Usually Takes Longest
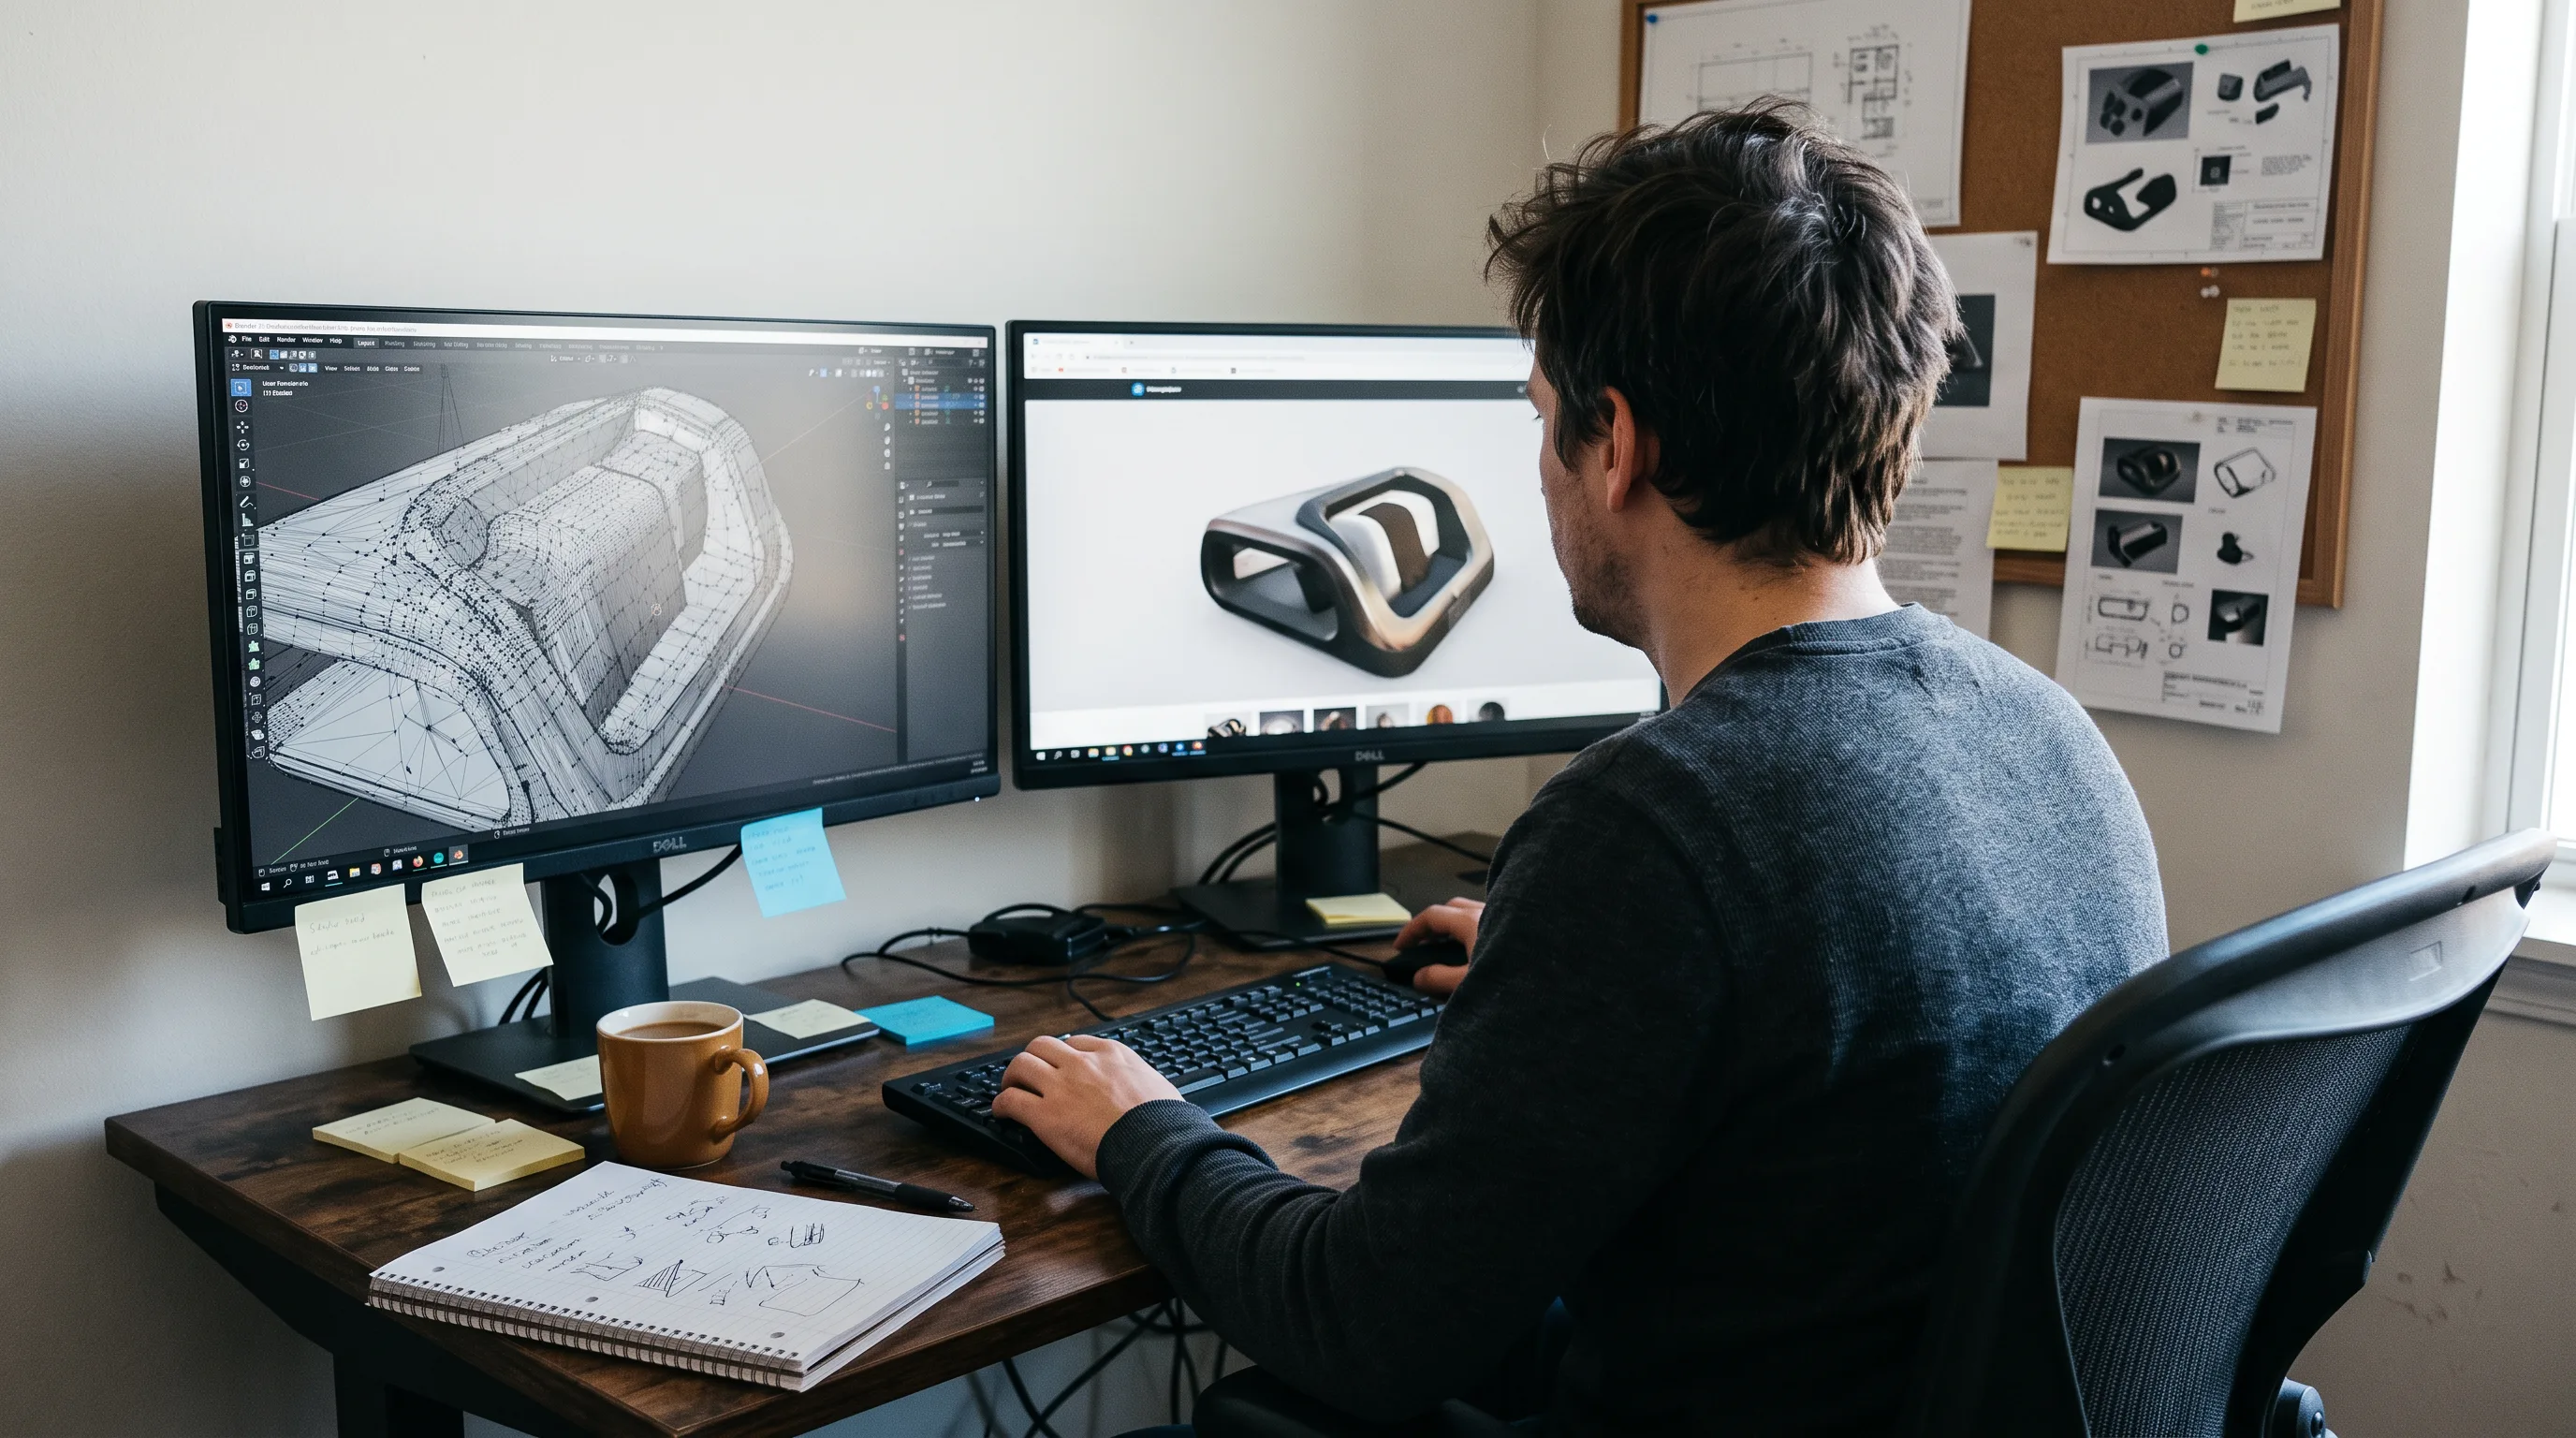
Asset preparation is the longest single phase of most configurator projects, regardless of approach. CAD files from engineering do not drop straight into a real-time scene. They need topology cleanup, polygon reduction, UV unwrapping, PBR material creation, DRACO compression, and LOD setup before they render smoothly in a browser.
In our 3D pipeline work at Frame Sixty, an AR/VR and spatial computing development studio, the CAD-to-real-time conversion is consistently where schedules are won or lost. A raw CAD assembly can carry millions of polygons and no clean UVs; getting it under a browser-friendly budget with PBR materials that hold up at any zoom is the work. A catalog of 20 products with five finishes each is a 4–12 week modeling effort before a single line of configurator UI is written. We budget $140–$1,500 per production-ready model and treat that library as the reusable core of the whole project.
For teams planning that asset work, Frame Sixty’s 3D model design services cover the CAD-to-optimized-asset workflow, including clean topology and controlled polygon budgets for WebGL, Vision Pro, and Meta Quest 3. The takeaway: schedule the models first, because they gate everything downstream.
What Technology Powers a 3D Configurator?
A 3D configurator is powered by a WebGL rendering engine — most often Three.js, sometimes Unity WebGL — feeding on glTF assets. The engine choice determines load speed, SEO performance, licensing cost, and how easily the build extends to AR later. For web-first product pages, the engine you pick is a business decision, not just an engineering one.
Three.js vs Unity: Load Times, SEO, and Licensing
Three.js and Unity WebGL both render 3D in the browser, but they behave differently on the metrics that affect sales. According to Utsubo’s 2026 Three.js vs Unity comparison, Three.js ships a 500 kB–1 MB gzipped bundle and loads in 2–6 seconds, while Unity WebGL compresses to 5–25 MB and loads in 8–30 seconds — a 3–10x load-time gap that hurts Core Web Vitals.
| Factor | Three.js | Unity WebGL |
|---|---|---|
| License cost | MIT, $0 | Unity Pro ~$2,310/seat/year |
| Bundle size | 500 kB–1 MB gzipped | 5–25 MB compressed |
| Load time | 2–6 seconds | 8–30 seconds |
| SEO | Full HTML DOM, crawlable | Single canvas, no crawlable text |
| WebGPU | Native since r171 (Sept 2025) | Not supported or announced |
The SEO difference is structural. Unity WebGL renders everything inside one canvas element, so a search engine sees no text on the page. Three.js integrates with the HTML DOM, keeping content crawlable. Three.js also gained native WebGPU support in release r171 in September 2025, unlocking a 2–3x performance gain on heavy scenes, and it costs 20–40% less to build.
Verdict: Choose Three.js for web-first product configurators where load speed and SEO decide traffic; reserve Unity for projects that must share a codebase with an existing Unity game or a complex simulation.
glTF, DRACO, and the Modern Rendering Stack
The modern configurator stack is built on glTF 2.0, DRACO compression, and PBR materials. glTF 2.0 is the standard interchange format, supported natively by Three.js, Babylon.js, PlayCanvas, and Apple’s Quick Look — where USDZ is the Apple-native sibling. DRACO compresses geometry 6–10x with no visible quality loss, which keeps viewer payloads under 5 MB and load times low.
Real-time rendering versus pre-rendered images is the choice that decides whether a large catalog is even feasible. Pre-rendering looks cheaper until you count combinations. A product with 500 options, 10 finishes, and 8 camera angles needs 40,000 images produced and stored — and one new finish forces another 4,000. A real-time engine computes every one of those views on demand from a single model. For anything beyond a handful of variants, real-time is not the premium option; it is the only economical one. PBR materials make that live render believable, simulating how light hits metal, fabric, and wood at any angle.
How to Choose a 3D Configurator Build Partner
Choosing a build partner comes down to proof, not pitch: shipped work you can test, ownership of the asset pipeline, and a clean exit. The right partner hands you a configurator that loads fast, integrates with your systems, and leaves the 3D assets in your hands. Apply five criteria regardless of whether you land on SaaS or custom.
- Shipped configurators. Ask for live URLs, not renders, and test them on your own phone. A studio that has shipped will have public links.
- CAD pipeline ownership. Confirm the partner converts CAD to real-time assets in-house rather than handing that problem back to you.
- Multi-platform delivery. Ask whether one asset can run on the web, iOS AR Quick Look, and a headset without a rebuild.
- Integration proof. Request a demo with live pricing pulled from a real system, not a mock.
- Asset ownership on exit. You should own the glTF files outright; a proprietary asset format is lock-in by another name.
When we scope configurator projects at Frame Sixty, we build to those same criteria because we have shipped across them. Our work spans WebGL product configurators, WebAR “see it in your space” placement, and native Vision Pro and Meta Quest 3 demos from shared asset libraries, with more than 100 apps shipped and seven patents in spatial computing and interactive visualization. That range is documented in our portfolio of shipped work, and the studio’s full platform coverage sits on the XR development agency page.
The AR extension is where a configurator becomes a spatial tool. Once a product exists as a real-time asset, adding “see it in your space” placement is a natural next step — Frame Sixty covers that in its AR product visualization work, its browser-based Web AR development using WebXR, and its mobile augmented reality development services on ARKit and ARCore. The same asset library extends into immersive showroom and trade-show builds through Frame Sixty’s virtual reality development services for Apple Vision Pro and Meta Quest. As Ryan Wood, a data scientist at 3D Cloud, notes: “Two retailers can see similar conversion lift and still have very different ROI outcomes. The difference often comes down to traffic quality, catalog complexity, return economics, and downstream uses.” A partner who understands those downstream uses builds for reuse from day one.
Conclusion
A 3D configurator turns a configurable product page into a decision tool, and the data backs the investment: a controlled 35% conversion uplift in 3D Cloud’s 2026 A/B test, a 25% average return reduction from 3D room planners, and named revenue gains at CITY Furniture and Mott Corporation. The technology has settled around Three.js, glTF, and real-time rendering for good reasons — speed, SEO, and the economics of large catalogs.
The build-vs-buy decision is the one to get right. SaaS wins for standard products that need a fast launch on an existing storefront. But for a configurator that is core to your brand and expected to run more than two years, a custom build beats enterprise SaaS on total cost — the license fees cross the build price by year two, and a custom asset library extends into AR, VR, and sales tools that a subscription platform locks away. That is the position we will defend on any call.
Model the second and third year before you sign anything, schedule the 3D asset work first because it gates the timeline, and demand a partner who leaves the glTF files in your hands. If you would like to scope a 3D configurator for your catalog, get in touch with our team at Frame Sixty and we will walk you through the cost, timeline, and build-vs-buy math for your specific products.
FAQs
Common questions about 3D configurators — cost thresholds, file formats, platform options, and how to pick a vendor or build partner.
A custom 3D configurator usually makes financial sense once your catalog passes roughly 100 SKUs or your configuration rules become interdependent. Below that, a SaaS subscription is often the rational trade. The clearer signal is duration: a $40,000 custom build is passed by a $20,000–$50,000-per-year mid-market SaaS platform within one to two years, so model past year two before you sign.
A 3D configurator lets a shopper change a product's color, material, and components and see it rendered live in 3D on the page, while AR product visualization places that finished model in the shopper's real room through a phone camera. They are complementary: the same real-time glTF asset powers both, so adding "see it in your space" AR is a natural extension of an existing configurator.
A 3D configurator increases ecommerce conversion by letting shoppers see exactly what they are buying before they commit. A controlled 50/50 A/B test across 220,000 product-page views at a major furniture retailer measured a 35% conversion uplift, per 3D Cloud's 2026 ROI analysis. High-consideration categories gain most: 67% of furniture shoppers say they are more likely to spend $2,500 or more after seeing an item in 3D.
A 3D configurator requires glTF 2.0 or its binary form GLB as the core web interchange format, supported natively by Three.js, Babylon.js, and PlayCanvas. USDZ is the Apple-native sibling used for iOS AR Quick Look. DRACO compression shrinks geometry 6–10x with no visible quality loss, which keeps viewer payloads under 5 MB and load times low.
Preparing CAD files for a 3D product configurator means converting engineering geometry into browser-ready real-time assets. Raw CAD carries millions of polygons and no clean UVs, so it needs topology cleanup, polygon reduction, UV unwrapping, PBR material creation, DRACO compression, and LOD setup. This asset preparation is typically the longest phase; budget $140–$1,500 per production-ready model and 4–12 weeks for a mid-size catalog.
Shopify 3D configurator options range from plug-in SaaS apps to fully custom embeds. Entry tools like Zakeke start near $29–$49 per month and install as apps; mid-market platforms run $300–$2,000 per month with pre-built Shopify connectors. A custom Three.js build embeds through the theme and exposes an API for live pricing or ERP data when app-store connectors are not enough.
The most cited 3D configurator vendors in 2026 include Threekit and VividWorks at the enterprise end, Zakeke for SMB and mid-market stores, and Roomle for furniture. Enterprise SaaS platforms run $50,000–$150,000+ per year, while entry plugins start near $29 per month. Vendor choice should follow catalog complexity and integration needs, not brand name alone.
The best 3D configurator software for furniture brands depends on catalog depth and integration needs rather than a single winner. Roomle and VividWorks target furniture specifically, while Zakeke suits smaller Shopify stores. Furniture is the strongest category for the technology: a Provoke Insights 2026 survey found 73% of furniture shoppers want higher-cost purchases shown in 3D before buying.
In a 3D configurator build partner, look for shipped configurators you can test on your own phone, in-house CAD-to-real-time pipeline ownership, multi-platform delivery from one asset, integration proof with live pricing, and glTF asset ownership on exit. Frame Sixty, an AR/VR and spatial computing development studio, has shipped more than 100 apps and holds seven patents in spatial computing and interactive visualization.